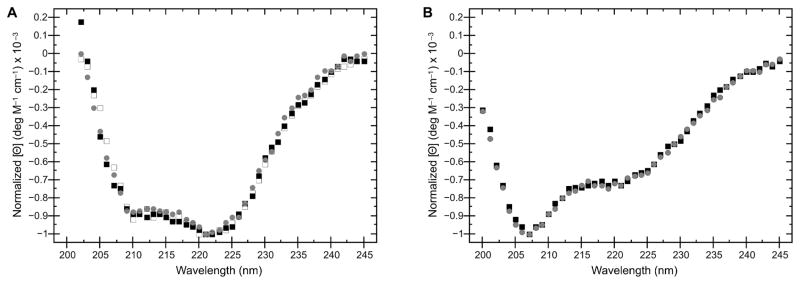
Figure 3. CD spectroscopy of KDAC variants.
A. Normalized CD spectra comparing wild-type KDAC8 purified from E. coli (black squares), as well as wild-type KDAC8 (grey circles) and KDAC8HA (white squares) purified from insect cells. B. Wild-type KDAC4 (black squares) compared to KDAC4HY (grey circles). Spectra indicate that there are no significant changes in secondary structure between wild-type KDACs and their respective variants, or due to the expression system used.

