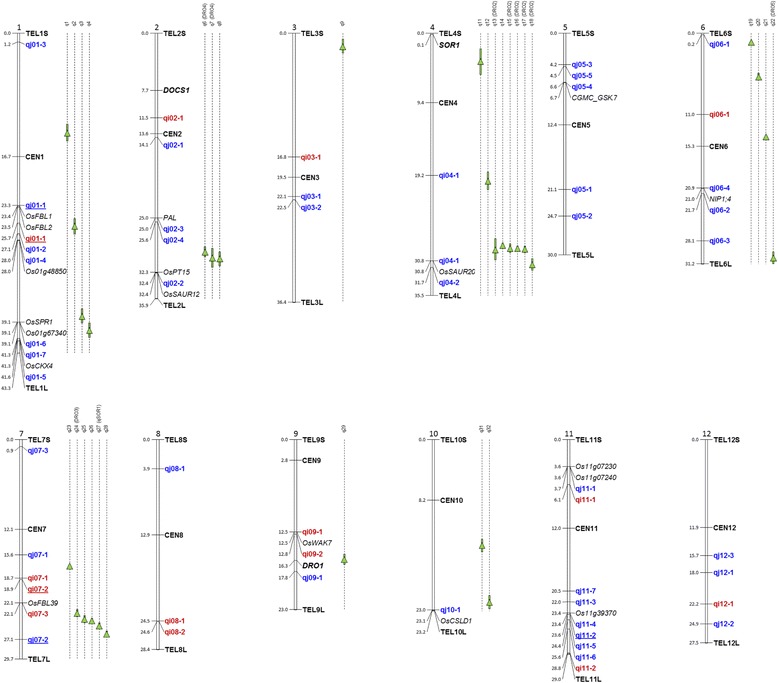
Fig. 2.

Position of genes and QTLs for root cone angle or related traits
In black, genes from the literature listed in Additional file 1: Table S1 and candidate genes from Table 9; in green QTLs from the literature listed in Additional file 1: Table S1; in red (indica panel) and blue (japonica panel), QTLs detected in this study (from Tables 3 to 8); QTLs detected both in GBS and HDRA panels are underlined.
