Fig. 5.

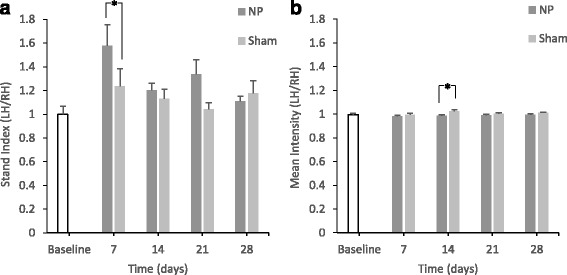
Changes in the parameters calculated from the data of maximum contact and light intensity (*p < 0.05) (A)
In the NP group, there are significant differences in the stand index compared with the sham group on day 7 (*p < 0.05). There are significant differences in mean intensity compared with the sham group on day 14 (*p < 0.05) (B).
