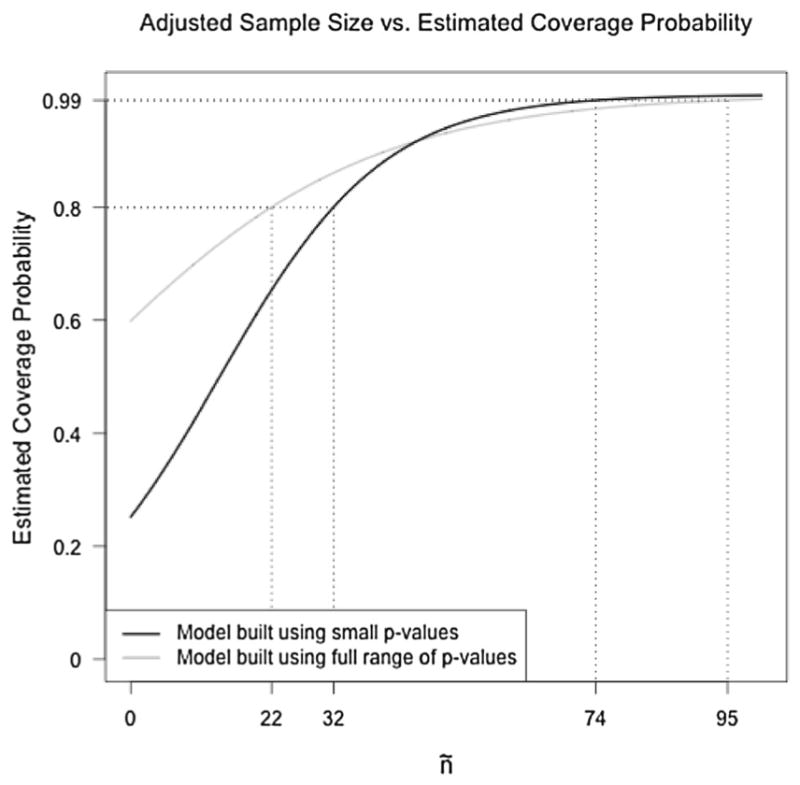
Figure 2.

Model-implied coverage probability as a function of ñ, where “coverage probability” refers to the probability that an analytic p value yields consistent results with a permutation test based on a 99%confidence interval for the permutation p value. The darker line corresponds to the model fit to data generated such that p < 0.05, and the lighter line corresponds to the model fit to data generated freely under H0.
