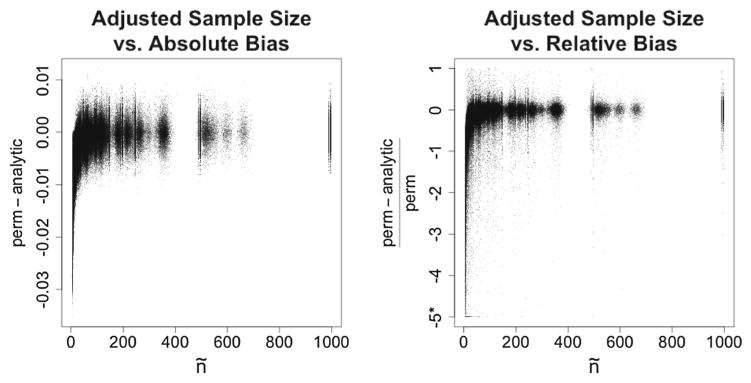
Figure 3.
Difference between permutation-based and analytic p values as a function of ñ. In the right panel, values smaller than −5 were recoded to −5 because a few outlying observations as small as −30 were obfuscating the figure. In both panels, note that as ñ becomes large, all differences are centered around zero, reflecting the high coverage when ñ is large.

