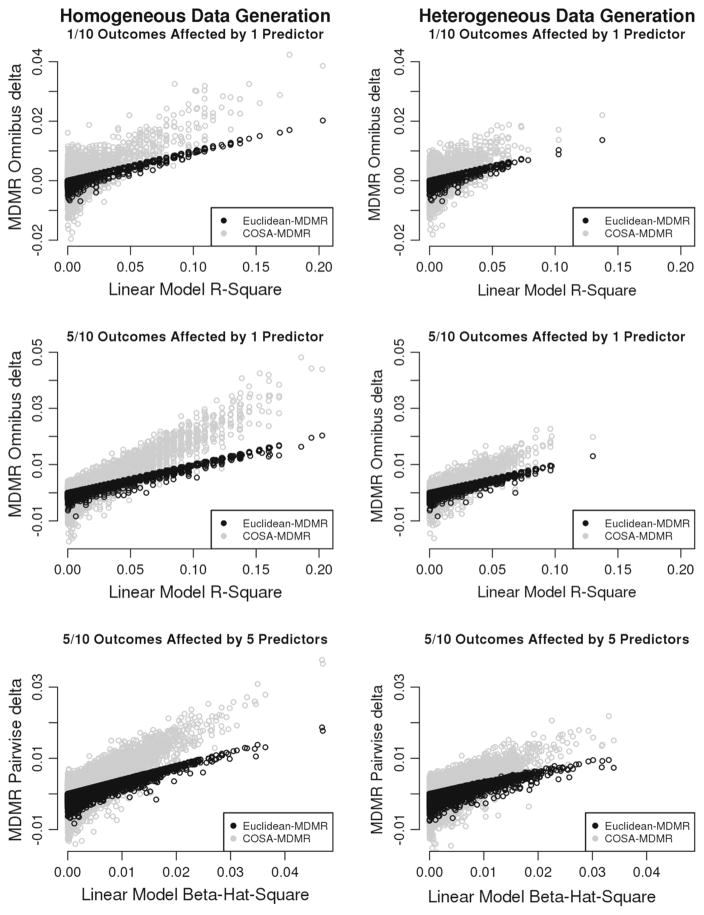
Figure 5.
Effect size measures of the linear model (horizontal axes) versus MDMR (vertical axes) with dichotomous outcomes. Like Fig. 4, each row corresponds to a data-generating model. The left column displays results coming from a homogeneous population in which the same outcome variables were affected in the entire population. The right column corresponds to scenarios in which two unobserved subgroups in the population differed in which outcome variables were affected by the predictor(s).

