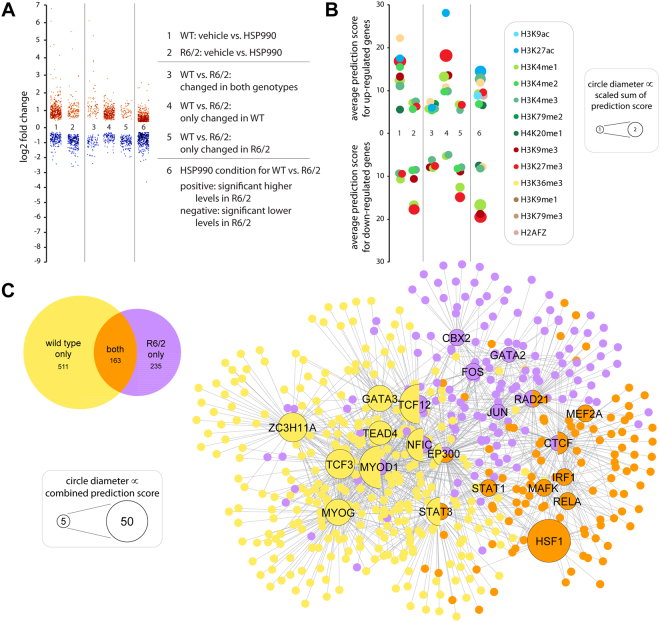
Figure 4.
Differential systemic response to HSP90 inhibition in R6/2 compared to wild type mice. (A) Scatter plot showing the significant log2 fold changes at 4 hours after HSP90 inhibition (HSP990) in quadriceps femoris muscle of R6/2 and wild type mice at 12 week of age. Each dot represents a gene. Lanes 1 and 2 represent the significantly regulated genes through HSP90 inhibition in R6/2 or wild type mice. Lanes 3 to 5 show the common (lane 3) and distinct (lanes 4 and 5) responses to treatment. Lane 6 compares HSP990 treated R6/2 with HSP990 treated wild type mice. Here, we corrected for differences due to the genotype by subtracting the log2 fold changes of significantly different genes (genotype) from their log2 induction value (HSP990). Only genes with a resulting fold change of ≥1.25 were considered for further analysis. (B) Chromatin mark predictions for genes shown in (A). Only significantly enriched chromatin marks (p < 0.001) were considered. We used the combined score, which is the product of the p-value with the z-score of the deviation from the expected rank, as a measure for prediction quality. Together, the average (y-axis) and the sum (circle diameter) of the combined scores are a good indicator of the confidence of the chromatin mark predictions. (C) Venn diagram and transcription factor network of common and distinct responses to HSP90 inhibition in R6/2 and wild type mice. Data correspond to lanes 3, 4 and 5 in (A) and (B). Numbers indicate the number of significantly regulated genes. To predict upstream regulators, we created gene lists for significantly regulated (up and down combined) genes for each condition and used the ENCODE transcription factor ChIP-seq database (2015) to identify the significantly enriched transcription factors (n ≤ 10 with a combined score of ≥ 5). Circle diameter is an indicator of the confidence of the predictions. See also Figures S2, S5 and S6.

