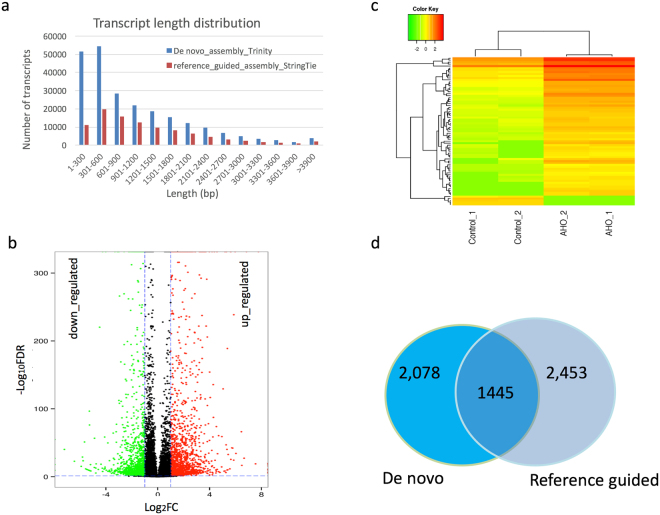
Figure 2.
Transcripts length and AHO induced differential gene expression in N. tabacum leaves. Image (a) shows the comparison of length distribution of transcripts which were de novo assembled and referenced guided assembly. Image (b) presents the differentially expressed genes (FDR < 0.05 and > = 2-fold change). Image (c) presents genes expression with at least 4-fold changes in gene expression with AHO treatment compared with control. Color represents the level of expression in FPKM after log2 transformation. _1 and _2 represent the two experimental repeats. Image (d) represents the shared DEGs from both assembly analyses.

