Figure 5.
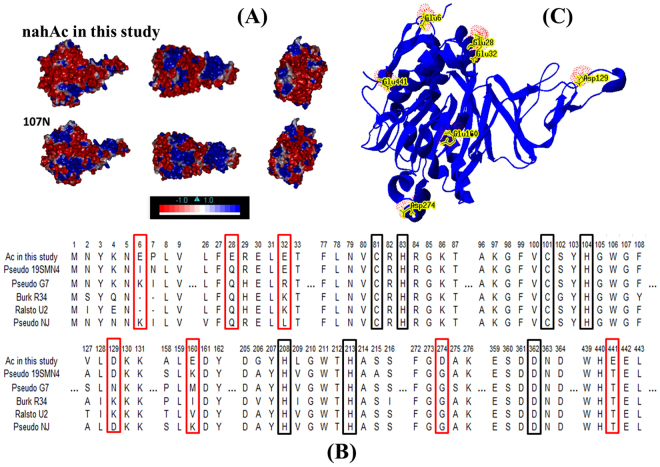
Surface electrostatic potentials analysis. (A) Surface electrostatic potentials of nahA3, and Naphthalene 1,2-dioxygenase from Pseudomonas putida NCIB 9816–4 (PDB no. 1O7N) as obtained using Discovery Studio 2.5 software. The first, second and third line were seen from the front, top and left of the structures, respectively, with the red surface corresponding to negatively charged residues and the blue surface corresponding to positively charged residues (color figure online). (B) The key amino acid sites in nahAc. Fe2+ binding sites are labelled in black squares and the sequence near these active sites are also shown. Mutated amino acid sites are labelled in red frame. (C) The position of these mutated sites appear at the surface of the large subunit. This graph is illustrated by Swiss-pdb viewer.

