Figure 3.

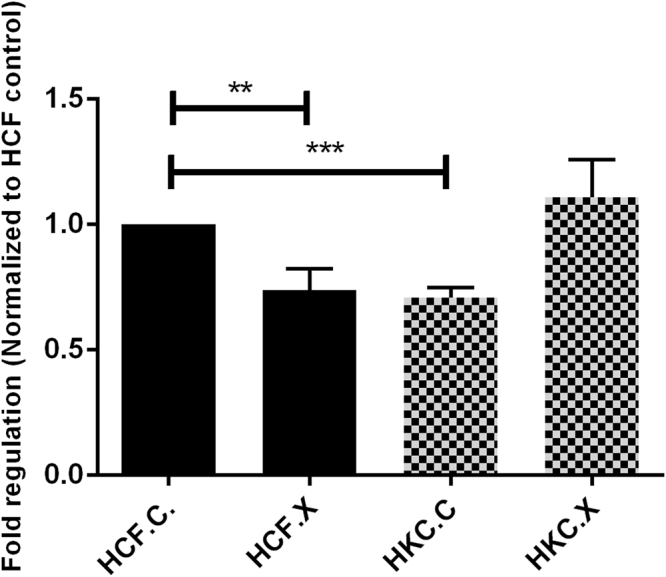
MTT assay quantification: HCF, HKC controls, and HCF and HKC CXL. Data was normalized to HCF controls and a fold regulation is plotted. One way ANOVA for a total n = 4 data sets. *(P = 0.0015), **(P = 0.0086), ***(P = 0.0008).

MTT assay quantification: HCF, HKC controls, and HCF and HKC CXL. Data was normalized to HCF controls and a fold regulation is plotted. One way ANOVA for a total n = 4 data sets. *(P = 0.0015), **(P = 0.0086), ***(P = 0.0008).