Figure 2.
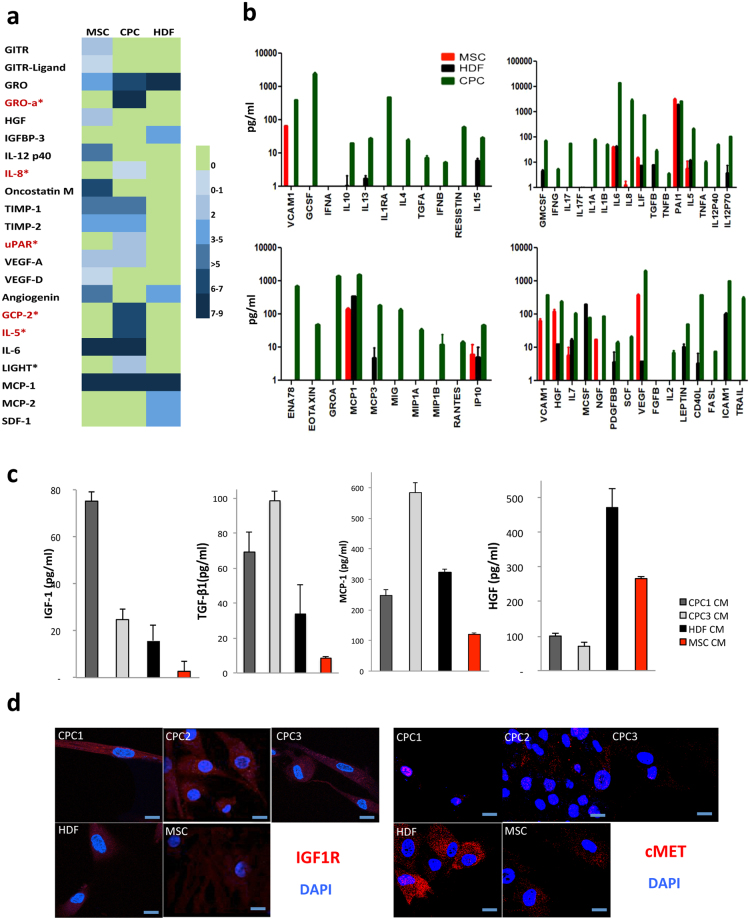
Comparative validation of the CPC secretome. (a) Conditioned medium from MSC, CPC and HDF were analyzed using an antibody array (122 cytokines). A color-scale of expression levels is included; proteins expressed specifically in CPC are in red. (b) Conditioned medium from MSC (red), HDF (black) and CPC (green) were analyzed using the Milliplex-MAP Human Cytokine/Chemokine Panel (Luminex); chemokine/cytokines are expressed in pg/ml. Duplicates were analyzed for two independent isolates from each cell lineage. (c) ELISA of CM from CPC1 (dark grey), CPC3 (light grey), HDF (black) and MSC (red). Duplicates were analyzed for each cell sample (n = 3). (d) Immunofluorescence analysis of IGF1R and HGFR (cMET) expression (red) in CPC1-3 compared with HDF and MSC; nuclei were DAPI-counterstained (blue). Bars, 20 μm.

