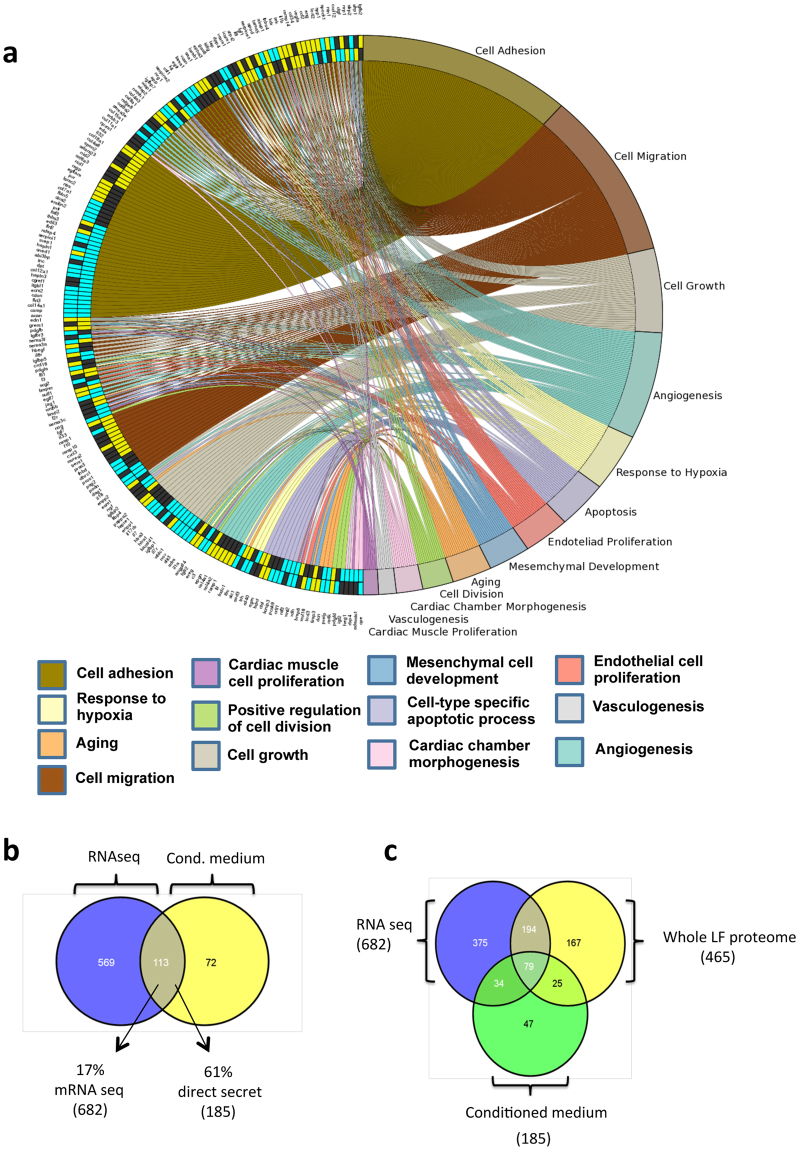
Figure 3.
Validation of the CPC secretome inferred from the transcriptomic analysis. (a) Comparative GO analysis of the CPC, MSC and HDF secretomes, carried out and visualized using the GOplot application. The representation shows up- (yellow) and downregulated (blue) genes differentially expressed in CPC (p < 0.02) relative to HDF (outer circumference) or MSC (inner circumference); non-differentially expressed genes are indicated (black). Colored network connects each gene(s) with main categories analyzed. (b) Comparison of the CPC secretome defined by mRNAseq (682 gene/proteins) with the direct proteomics secretome obtained from CM (185 proteins). (c) Venn diagram of the comparison of data from mRNAseq studies (682 gene/proteins), whole LF proteomics (465 proteins) and direct secretome analysis (185 proteins); only 79 gene/proteins were found in all three data sets.

