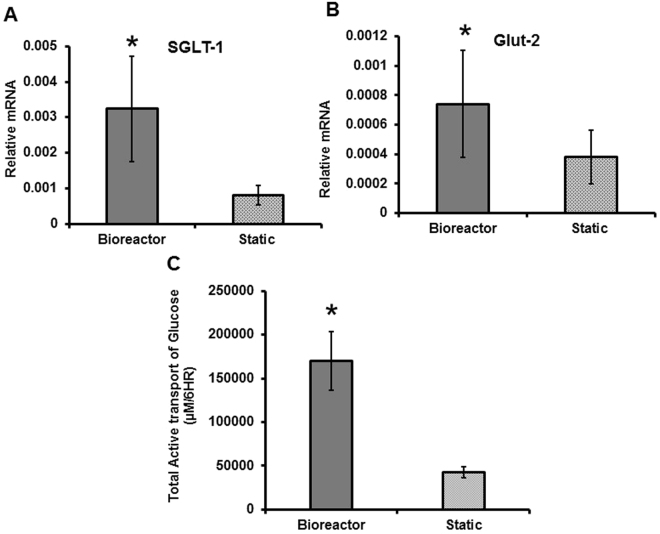
Figure 6.
Relative mRNA levels of glucose transporters SGLT-1 (A) and Glut-2 (B) in Caco-2 grown in bioreactors under shear stress and control scaffolds under static conditions. Significance was determined by a Student’s t-test. N = 6. Active transport of glucose over 6 hours in the bioreactors and static scaffolds (C). For statistical differences, the area under the curve (AUC) was calculated for each sample and then significance was determined using a Student’s t-test (B). N = 3.

