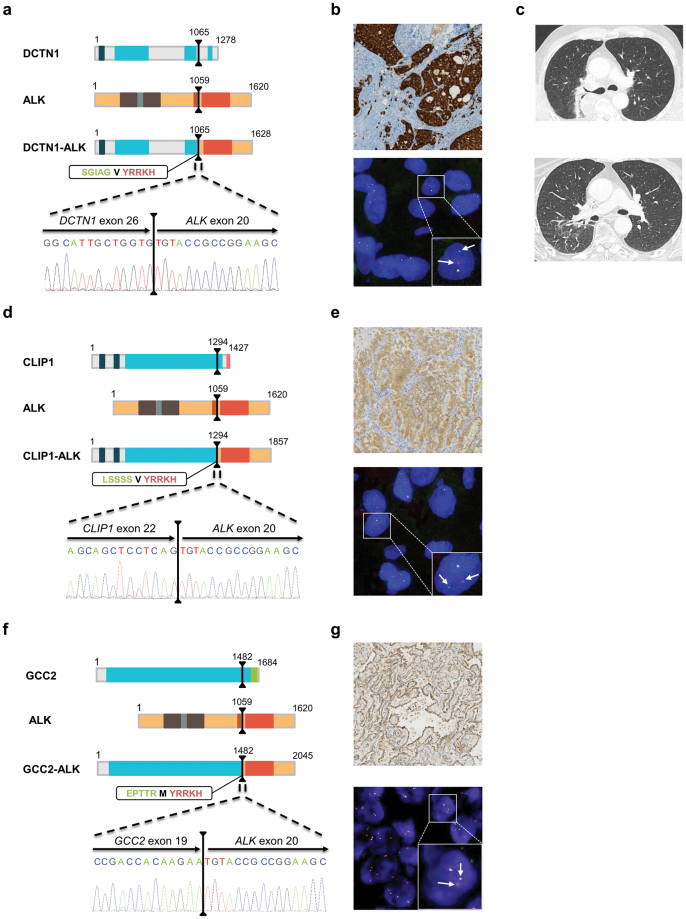
Figure 2.
Detection of one rare DCTN1-ALK fusion transcript, one new CLIP1-ALK fusion, and one new GCC2-ALK rearrangement in patient samples. (a,d and f) Schematic representation of the main functional domains of the proteins. The black lines represent the breakpoints and the dashed lines zoom in on the transcript fusion points and the electropherogram of the validation test. The amino acid (aa) sequences at the fusion points are highlighted in a rectangle: the green bolded sequences correspond to the fusion partner, the red bolded sequence to the ALK sequence, and the black bolded aa to the aa generated by the fusion of the codon from the fusion partner and ALK. The protein functional domains are represented as colored boxes: deep blue box, Cytoskeleton-associated protein glycine-rich (CAP-Gly) domain; light blue box, coiled-coil domain; brown box, Meprin/A5-protein/PTPmu (MAM) domain; grey box, LDL-receptor class A domain; orange box, transmembrane domain; red box, kinase domain; pink box, zinc finger domain; green box, GRIP domain. (b,e and g) IHC and FISH images showing the presence of ALK rearrangements in patient samples. Top panel, IHC imaging showing an intense cytoplasmic staining. Bottom panel, representative image of a slide hybridized with a break-apart ALK FISH assay. In this given example, the box highlights one nucleus harboring a split (arrows) and a fused signal. (c) Thoracic CT scan of patient S36 before (top panel) and after (bottom panel) three months of crizotinib therapy. IHC, immunohistochemistry; FISH, fluorescence in situ hybridization; CT, computed tomography.

