
Figure 6.
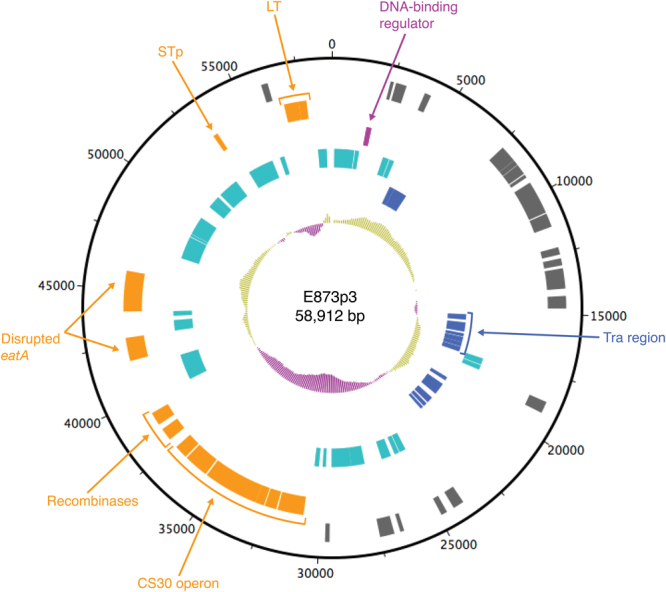
Graphical map of plasmid E873p3 harboring the CS30 gene cluster. The innermost circle represents G+C content (%) with greater (light green) to less (purple) than average (0.46). The tracks from the inside represent: (1) replication and plasmid maintenance genes; (2) insertion sequences (IS) and transposon related genes; (3) regulatory genes; (4) virulence genes; (5) other coding DNA sequences (CDS). The genes mentioned in the text are indicated with arrows with the same color as their CDS.