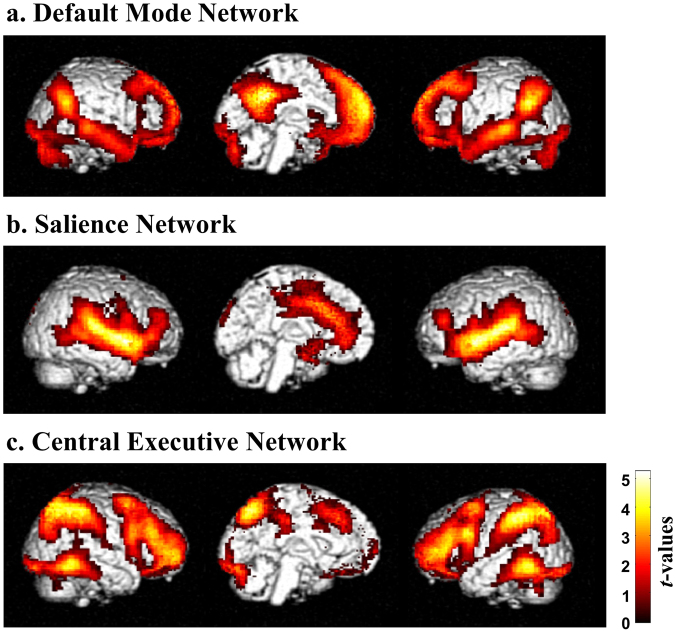
Figure 1.
Average functional connectivity maps across 99 participants computed for BOLD time series using seed-based analysis (cluster-level family-wise error corrected, p < 0.001). These connectivity maps are independent representations of (a) the default mode network, (b) the salience network and (c) the central executive network. The functional connectivity of the networks is shown in the left lateral, midline and right lateral views from left to right.

