
Figure 3.
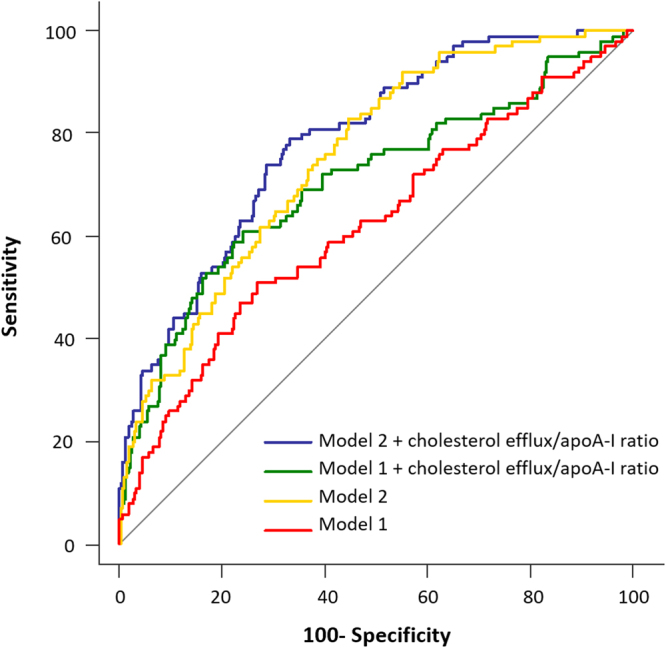
Receiver operator characteristic (ROC) curves from logistic regression models predicting T2DM. Model 1 (red line, AUC = 0.620) included the variables age, sex, BMI, smoking status, alcohol drinking, lipid-lowering treatment, hypertension, serum triglycerides and batch number. Model 2 (green line, AUC = 0.704) included the variables in model 1 plus glucose metabolism variables (Disposition Index, HOMA-IR and HbA1c). When cholesterol efflux/apoA-I ratio was added to both model 1 (yellow line, AUC = 0.753) and model 2 (blue line, AUC = 0.785), the prediction of both models increased significantly (p < 0.001).