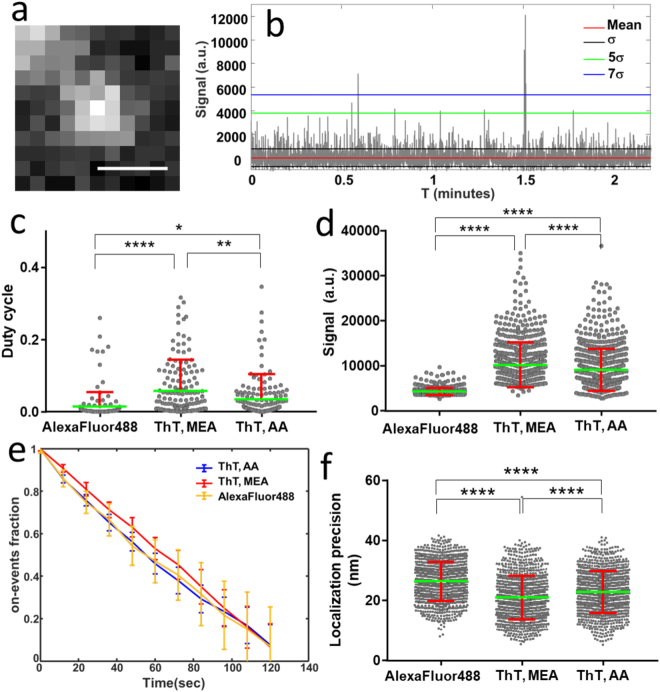
Figure 1.
(a) Typical single ThT molecule image depicting the integration area used for the intensity time trace analysis. Scale bar: 500 nm. (b) Typical time trace (backround is removed) obtained at the location of a single ThT molecule (in MEA conditions), showing the standard deviation of the noise , and the magnitude of a few . (c) Average duty cycle obtained for the different conditions: ThT in MEA (n = 191), ThT in AA (n = 191), Alexa Fluor 488 in MEA (n = 155) deposited on a glass substrate (n: number of time traces over 6 different measurements, for each condition). (d) on-event signal (in camera counts) obtained for the different conditions: ThT in MEA (n = 774), ThT in AA (n = 774), and Alexa Fluor 488 in MEA (n = 774) (n: number of detected on-events, for each condition). The thresholding is . (e) Photostability duration of detected molecules (e.g. decrease of on-events over time measured from time traces), normalized to the total number of on-events and represented in a cumulative plot, averaged over 6 measurements per condition. (f) Localization precision deduced per detected single molecule in a dSTORM movie stack, for ThT in MEA (n = 1000), ThT in AA (n = 1000), and Alexa Fluor 488 in MEA (n = 1000). All error bars represent the standard deviation over n, number of measured samples.

