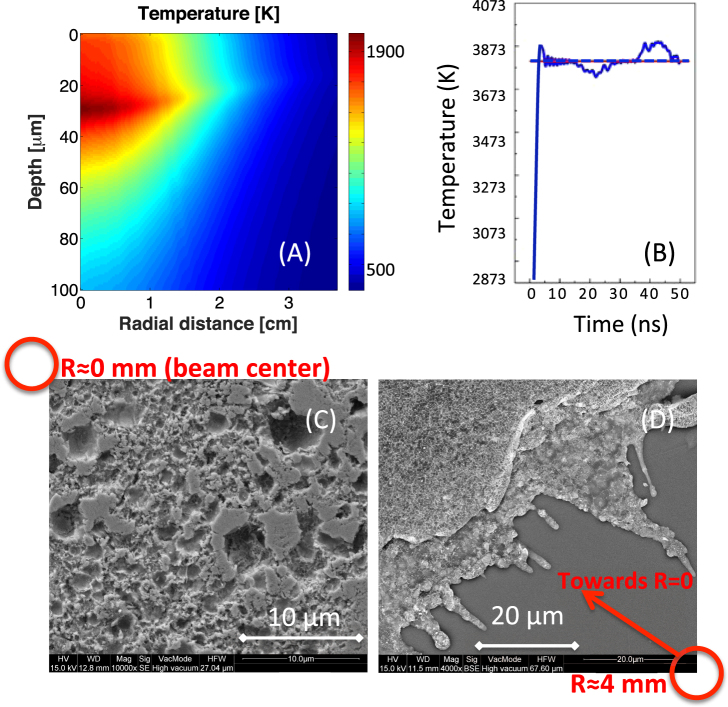
Figure 2.
(A) Computed temperature map of the gold sample, about 900 ps after irradiation, The target is located at 2.5 cm in order to adapt the proton flux to the requested temperature conditions. The 0 level indicates the target surface in front of the proton beam; (B) Temperature evolution in time, monitored on the target surface. The temperature has been computed in the warmer region at a penetration depth of 40 μm and at a radial position of nearly beam center. The maximum temperature shown in Fig. (A) does not correspond to the maximum temperature as found in Fig. (B) since in Fig. (A) the sample temperature is still in the onset phase. After the onset, the temperature stays above the boiling point for tens of ns, ensuring the duration of the plume. The blue dashed line is a guide for the eye showing the mean value. (C) SEM image of the gold target that has been irradiated by the laser-generated protons, image taken near the beam center that is indicated with a red circle. (D) SEM image of the same target as in (C) but at a beam distance of 4 mm (indicated with a red circle), the beam center direction is indicated with a red arrow.

