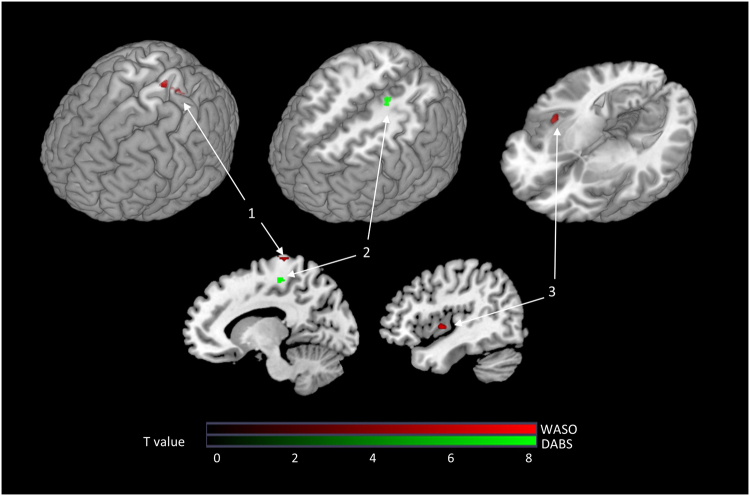
Figure 5.
Brain areas where changes in the BOLD response to SS after CBT-I correlated significantly with clinical improvement in insomnia after CBT-I. 1: Left superior paracentral cortex. 2: Left inferior paracentral cortex. 3: Right insula. (A) Decrease in WASO after CBT-I was correlated with a reduction in the left superior paracentral BOLD response to SS. (B) DBAS score decrease after CBT-I correlated with a decrease in the left inferior paracentral BOLD response to SS. (C) WASO decrease after CBT-I correlated with a decrease in the right insular BOLD response to SS. Note: The BOLD response to SS was calculated by subtraction of the BOLD response to NS from the BOLD response to SS (SS-NS).

