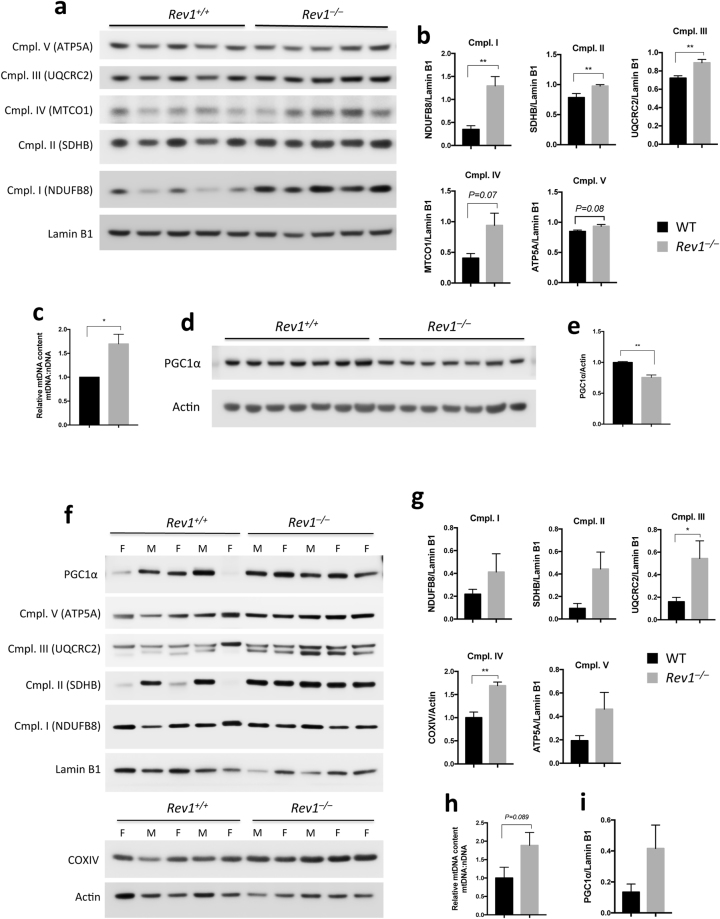
Figure 2.
Mitochondrial content and biogenesis. (a,b,f,g) Immunoblot analysis of the subunits of mitochondrial complexes in MEF cells (n = 5; df = 4) (a,b) and in liver (n = 5; df = 8) (f,g). (b,g) Quantifications of Cmpl. I-V protein levels from (A) MEFs and (f) liver, respectively. Cmpl. I (NDUFB8, NADH dehydrogenase 1 beta subcomplex subunit 8) (MEFs: t = 4.981; Liver: t = 1.17); Cmpl. II: SDHB (Succinate dehydrogenase iron-sulfur subunit) (MEFs: t = 3.685; Liver: t: 2.23); Cmpl. III: UQCRC2 (Cytochrome b-c1 complex subunit 2) (MEFs: t = 5.411; Liver: 2.383); Cmpl. IV: MTCO1 (Cytochrome c oxidase subunit 1) (MEFs: t = 2.378); COXIV (Cytochrome c oxidase subunit 4) (Liver: t = 4.79); Cmpl. V: ATP5A (ATP synthase subunit alpha) (MEFs: t = 2.302; Liver: t = 1.806). (c,h) Analysis of mtDNA content number by qPCR in MEF cells (n = 4; t = 3.544; df = 3) (c) and liver (n = 5; t = 1.944; df = 8) (h). The mtDNA content was calculated as the mtDNA/nDNA ratio using primers specific for the mitochondrial TrnL1and nuclear β-2-microglobulin (β2M) genes. (d) Immunoblot analysis of PGC1α in MEFs (n = 7; t = 5.764; df = 6). (e) Quantification of PGC1α protein levels from (d) MEFs. (i) Quantification of PGC1α protein level in the liver of WT and Rev1−/− 5 months old mice (t = 1.761). n = sample number; t = t value; df = degree of freedom; *p < 0.05. **p < 0.01. ***p < 0.001. ****p < 0.0001. Data presented are mean ± M.S.E.

