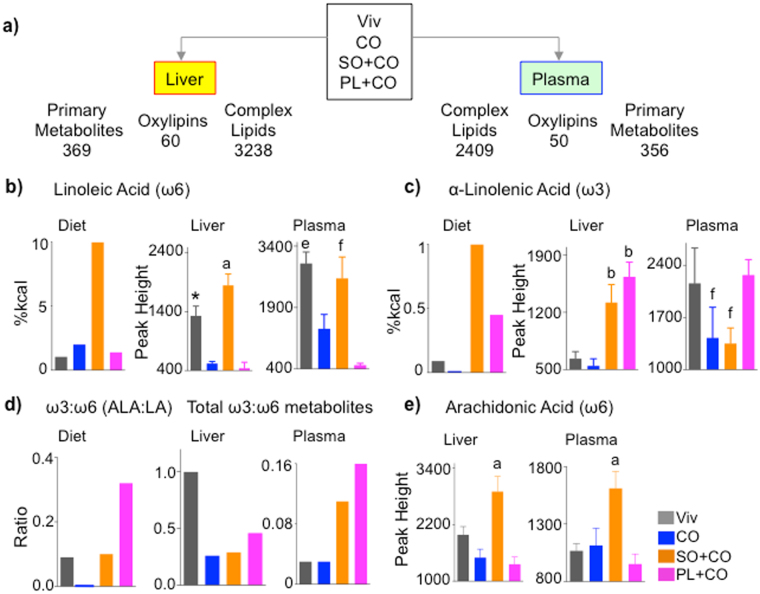
Figure 2.
Metabolomic analysis reveals variations in fatty acid accumulation in liver and plasma between conventional soybean oil and Plenish. (a) Schematic of total number of metabolites identified by the various platforms in liver and plasma of mice fed the indicated diets. (b,c,e) Levels of the indicated fatty acids in the diets and liver and plasma of mice fed the respective diets. N = 7–8. (d) Ratio of ω3:ω6 fatty acids in diet (ALA:LA) and total ω3:ω6 oxylipins in liver and plasma. *Significantly different from all others. aSignificantly different than all others, bthan CO and Viv, ethan CO and PL + CO, fthan PL + CO. Data are presented as ± SEM, except for graphs showing levels or ratios in diets.

