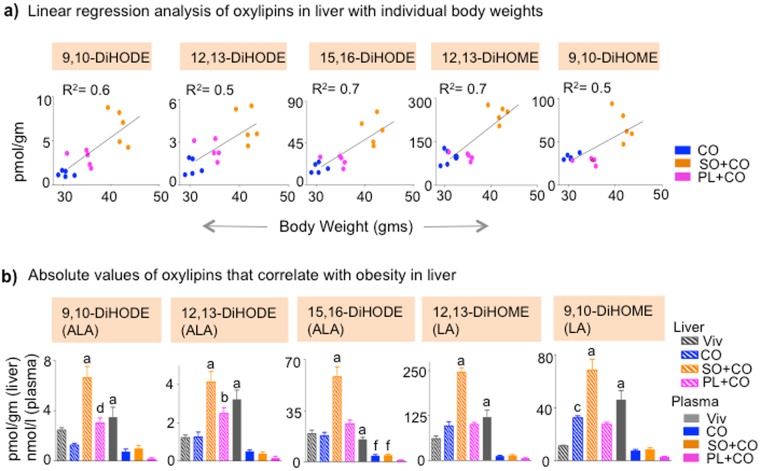
Figure 3.
Liver oxylipins correlate with soybean oil-induced obesity. (a) Correlation between body weight and concentration of liver oxylipins of individual mice. Spearman correlation coefficient (r) is 0.8 for 9,10-DiHODE (P = 0.0007), 0.8 for 12,13-DiHODE (P = 0.0009), 15,16-DiHODE (P = 0.0009), 0.6 for 12,13-DiHOME (P = 0.02) and 0.5 for 9,10-DiHOME (P = 0.06). Goodness of fit or R2 values for linear regression are indicated on the graphs. (The Viv group was not included in the correlation analyses in Supplementary Fig. S4a,b,c). (b) Absolute levels of oxylipins that correlate only in liver (hatched bars). Values in plasma (solid bars) are shown as a comparison. N = 4–5 mice per group. aSignificantly different (within same tissue) from all others, bfrom CO and Viv, cfrom Viv, dfrom CO, ffrom PL + CO. The fatty acid from which the oxylipin was derived is shown in parentheses. Data are presented as ± SEM.

