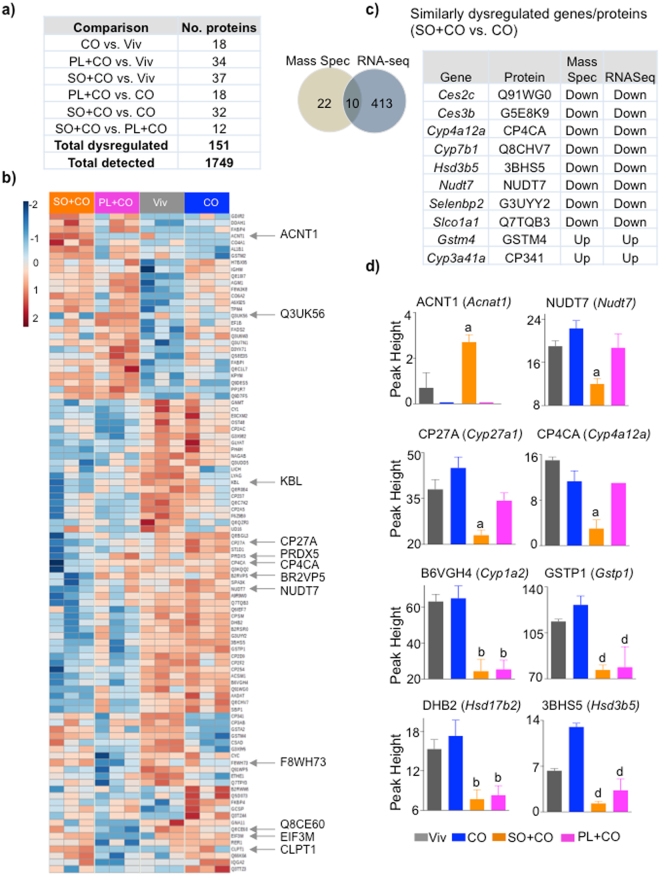
Figure 4.
Proteomic analysis of liver reveals changes induced by both conventional and GM soybean oil. (a) Number of significantly dysregulated proteins in the livers of C57BL/6 N male mice fed the indicated diets (P ≤ 0.05, Tukey’s post hoc test). (b) Heatmap showing liver proteins that are significantly different between any two diets. Arrows, significantly different proteins between SO + CO and PL + CO. N = 3 livers per group. (c) Left: Venn diagram showing overlap of dysregulated proteins between CO and SO + CO fed livers identified by mass spectrometry and RNA-Seq analysis13. Right: List of similarly dysregulated proteins in SO + CO versus CO livers. (d) Proteins that are different in SO + CO or PL + CO compared to any other diet. aSignificantly different from all others, bfrom CO and Viv, dfrom CO. P ≤ 0.05 by One-way ANOVA, Tukey’s post-hoc analysis. Data are presented as ± SEM.

