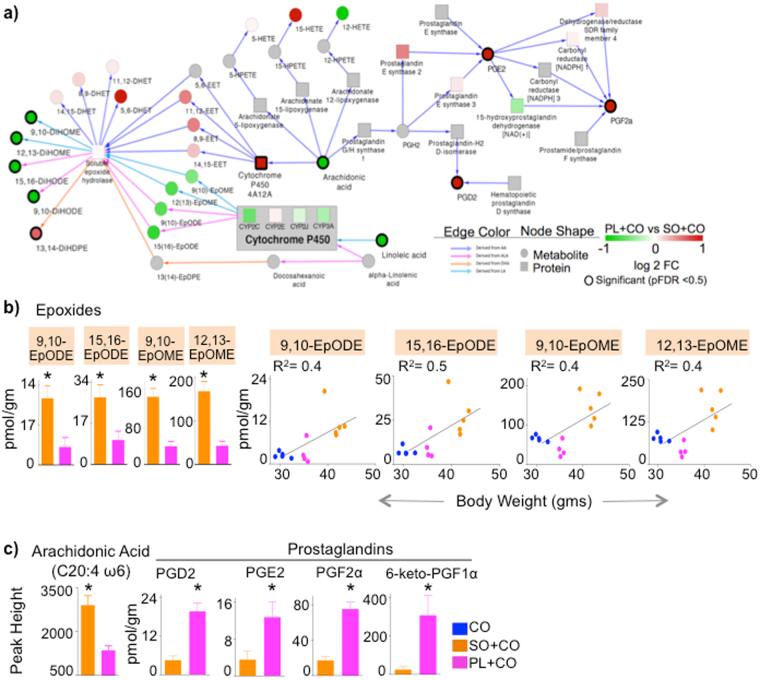
Figure 5.
Alterations in LA-, ALA- and AA-metabolizing enzymes in SO + CO versus PL + CO livers correlate with oxylipin and prostaglandin levels. (a) Integrated proteomic-metabolomic network analysis comparing PL + CO and SO + CO livers based on significant metabolites/proteins (black borders) (pFDR < 0.05) and their connecting nodes. Node colors: red, up in PL + CO; green, up in SO + CO; white, no change; gray, no data mapped to nodes. (b) Left, absolute levels of EPOMEs and EPODEs shown in (a) (one outlier mouse in the PL + CO group was removed). Right, Correlation between body weight and concentration of liver epoxides of individual mice. Spearman correlation coefficient (r) is 0.6 for 9,10-EpODE (P = 0.02) and 15,16-EpODE (P = 0.03), 0.5 for 12,13-EpOME (P = 0.07) and 9,10-EpOME (P = 0.08). Goodness of fit or R2 values for linear regression are indicated on the graphs. c) Levels of arachidonic acid (AA) and prostaglandins in liver. N = 4–5 mice per group. *Significantly different (P < 0.05). Data are presented as ± SEM (b and c).

