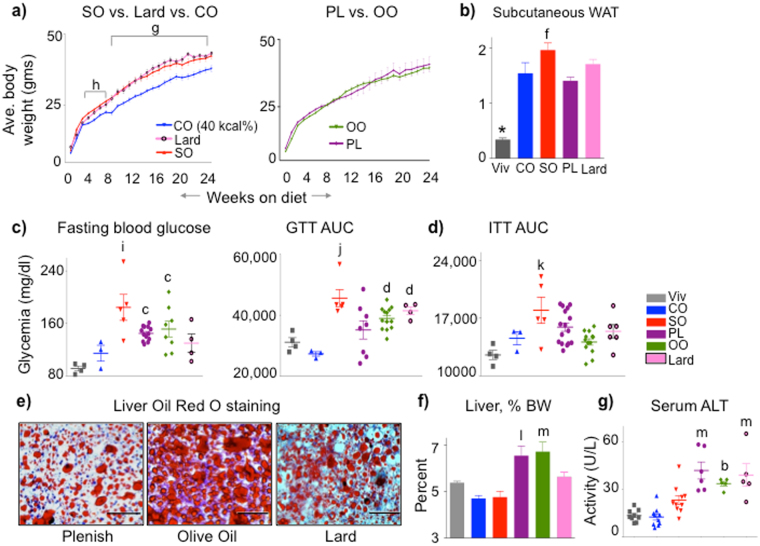
Figure 6.
Plenish induces similar metabolic effects as olive oil; conventional soybean oil is similar to lard. (a) Average weekly body weights of C57BL/6 N male mice started on the indicated diets at weaning. High fat diets (35 kcal%) with a single fat source: SO, soybean oil only; PL, Plenish oil only; OO, olive oil only. CO (40 kcal%) is as in Fig. 1. N = 7–16. gCO significantly different from SO and lard, or hfrom SO. (b) Average mass of subcutaneous (flank) fat pads from mice on diets for 24 weeks. *Significantly different from all others, ffrom PL. (c) Fasting blood glucose (18–20 weeks). N = 10–13. iSignificantly greater than Viv, CO and lard, cthan Viv. AUC, area under the curve of a GTT assay (18-20 weeks). N = 4–13. jSignificantly greater than CO, PL and Viv or dthan CO. (d) AUC of ITT (18 weeks). N = 5-12 except CO (N = 3) and Viv (N = 4). kSignificantly greater than Viv and OO. (e) Representative Oil Red O staining of livers. Scale bar is 100 microns. N = 4–6 per group. (See Supplementary Fig. S6e for SO and Supplementary Fig. S2 for additional sections) (f) Liver weight as percent body weight. N = 10–13. (See Supplementary Fig. S6g for absolute liver body weight) (g) Serum ALT activity. N = 5–10. For (f) and (g), lsignificantly greater than all others except OO, mthan SO, CO and Viv or bthan Viv and CO. All data are presented as ± SEM.

