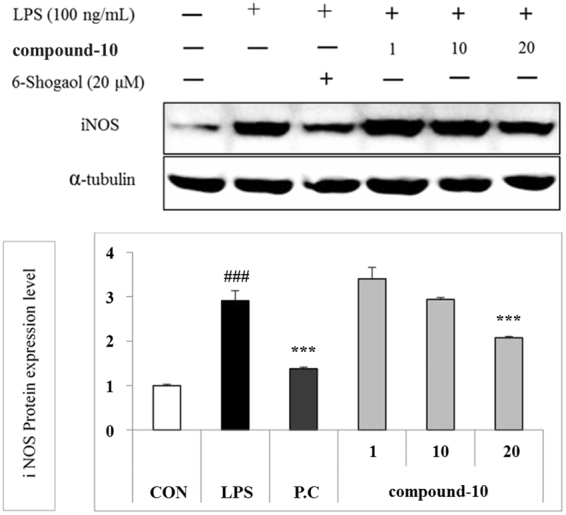
Figure 13.

Modulation of LPS-induced iNOS expression by compound 10 in BV-2 microglial cells. BV2 cells were pretreated with the compound for 30 min and then stimulated with 100 ng/mL of LPS for 6 h. The cell lysates were extracted, and the protein levels of iNOS were analysed by Western blotting. (A) iNOS expression in LPS-activated BV2 cells. (B) Densitometric analysis of iNOS expression. α-Tubulin was used as the loading control. The figures show the representative results of three independent experiments. ### P < 0.001 compared to the untreated control, *P < 0.05, and ***P < 0.001 compared to the LPS-treated group.
