Table 3.
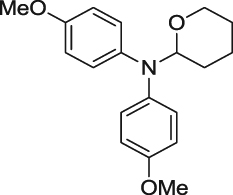
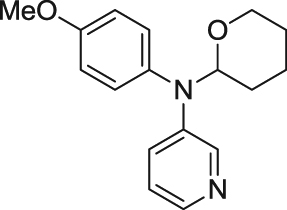
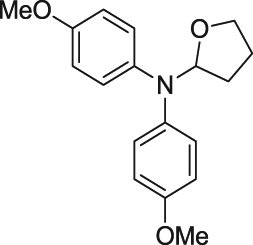
Inhibitory effects of compounds (4a–f, 5, and 10) on LPS-induced NO production in BV-2 cells.
| Entry | Compound | Structure | Yield (%) | IC50(µg/mL)a | Entry | Compound | Structure | Yield (%) | IC50(µg/mL)a | |
|---|---|---|---|---|---|---|---|---|---|---|
| 1 | 4a |
|
70 | 75.66 | 6 | 4f |
|
78 | 20.21 | |
| 2 | 4b |
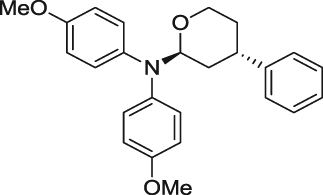
|
89 | >500 | 7 | 5 |
|
31 | >500 | |
| 3 | 4c |
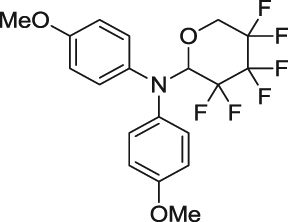
|
45 | 162.49 | 8 | 10 |
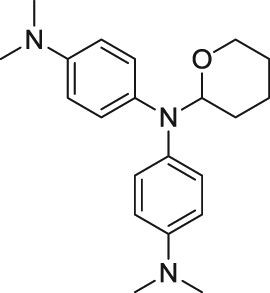
|
65 | 12.57 | |
| 4 | 4d |
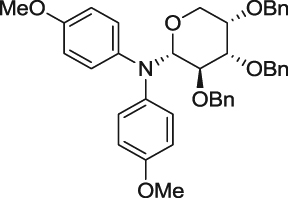
|
80 | >500 | 9 | 6-Shogaolb |

|
- | 5.59 | |
| 5 | 4e |
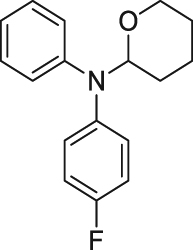
|
99 | >500 |
aData are presented as means ± of three independent experiments. bPositive control.
