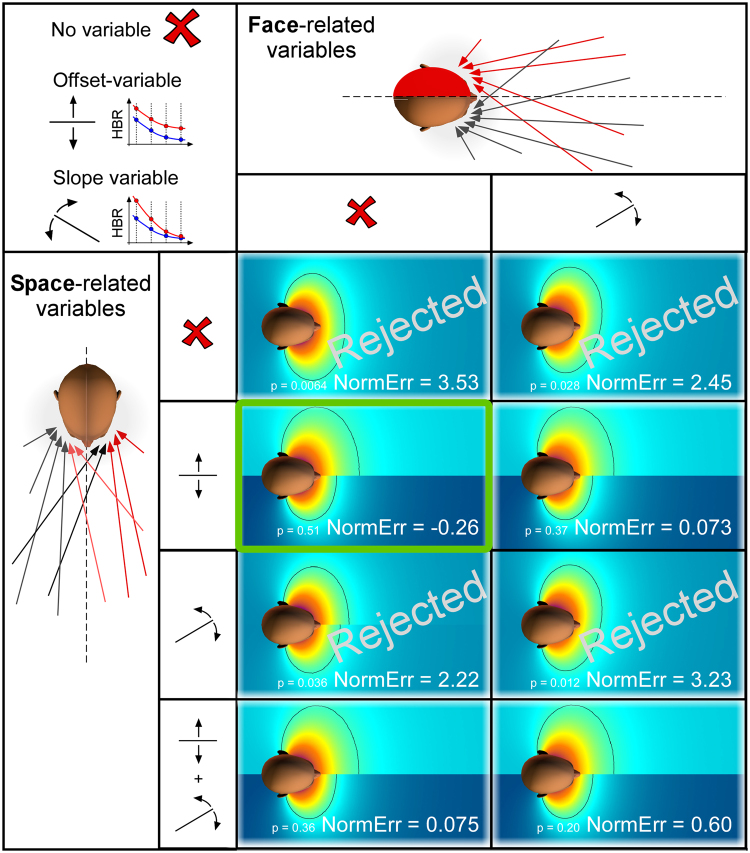
Figure 2.
Geometric properties of the DPPS of the face predicted by each of the 16 tested models. We considered two classes of variables, representing underlying neurophysiological explanations for all possible TN-induced changes in DPPS shape and size. The first class of variables reflects that an event hitting the side of the face affected by TN is estimated to do more harm (columns). The second class of variables reflects that an event occurring in the side of space ipsilateral to the TN is estimated to do more harm (rows). Since the geometrical modelling calculates the probability of an environmental stimulus to hit the face, and assumes a linear relationship between that hit probability and the HBR magnitude12, the first (face) explanation could be modelled with one parameter: a change in slope (i.e. a multiplicative factor). In contrast, the second (space) explanation could be modelled using up to two variables: either a change in offset (i.e. an additive factor), or a change in slope (i.e. a multiplicative factor), or both. The resulting matrix shows the best model fit resulting from each of all possible combinations of the variables. Note that in some cases, adding a variable has only a very small effect on the resulting fit, which explains why some model fits look very similar. The ‘NormErr’ is a measure of the goodness of fit: it is a normalised measure of how much more error each model gives in its fit to the data than expected. Therefore, the smaller (or more negative) the NormErr, the better the model fit. The p-values indicate whether a model is rejected (P < 0.05) or not (P > 0.05). DPPS models which did not pass goodness-of-fit testing are rejected, whereas the model that fitted the data best is highlighted in green.

