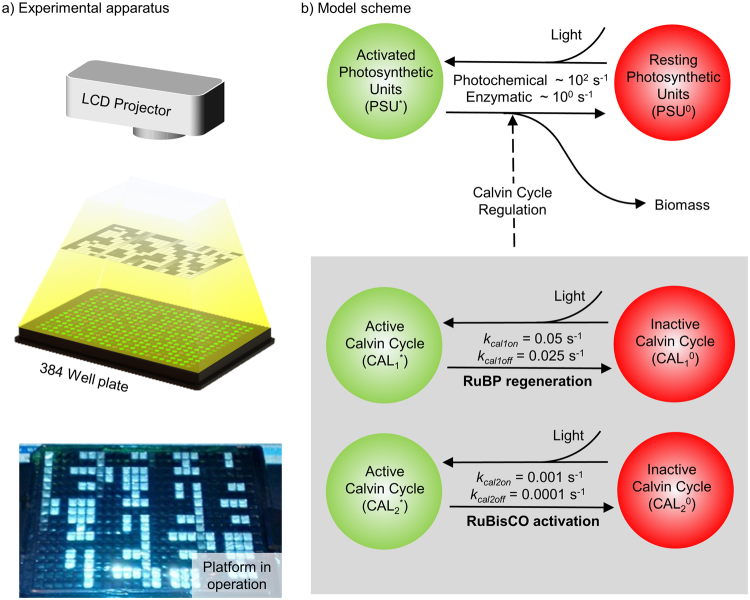
Figure 1.
Combined experimental and analytical approach. (a) Schematic of irradiance technique used, consisting of a well plate aligned to a projector, with a sample image of the well plate being illuminated by the projector. (b) Model scheme. In the top row, photosynthetic units are excited by light, then decay to produce additional biomass. The bottom row shows regulation of the Calvin cycle by light. Specifically, the activation rates for the components of the Calvin cycle (k cal1on and k cal2on) are the indicated values in the light and 0 in the dark. In contrast, the off rates (k cal1off and k cal2off) are constant through the light and dark phases.

