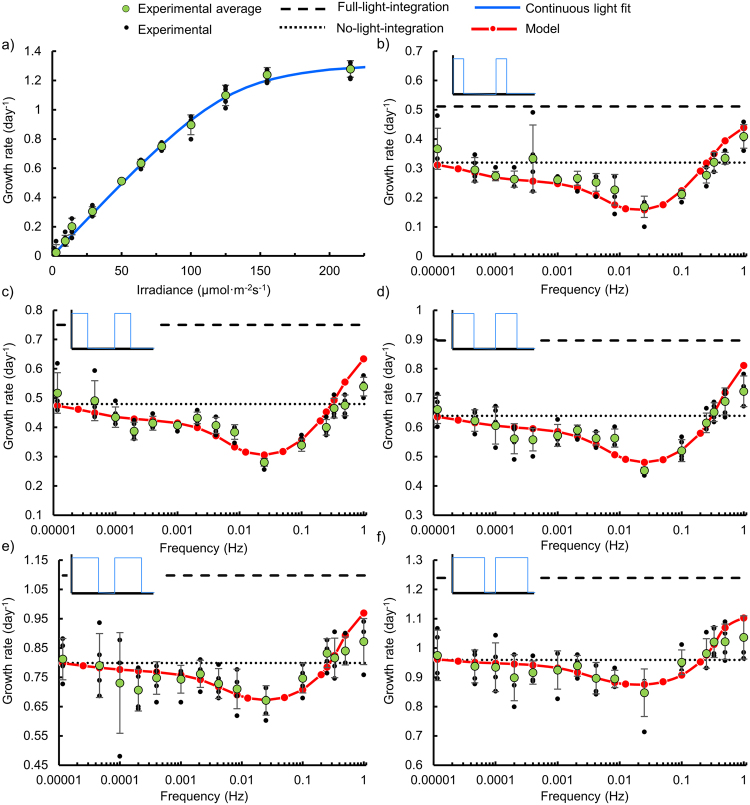
Figure 2.
Summary of experimental data demonstrating a frequency dependent penalty for flashing light with corresponding model. (a) Steady state growth vs irradiance curve with the model fit to extract parameters α, κ and Pm (R2 = 0.997). The effect of frequency for various duty cycles is shown in (b–f) for square waves alternating between 215 and ≈0 µmol·m−2 s−1 with duty cycles of 0.25, 0.375, 0.5, 0.625 and 0.75 respectively. Dashed lines in (b–f) correspond full-light-integration and dotted lines correspond to no-light-integration. Experimental data corresponds to the mean and standard deviation of four data points, from a single well plate, after two days of growth, individual data points are also included.

