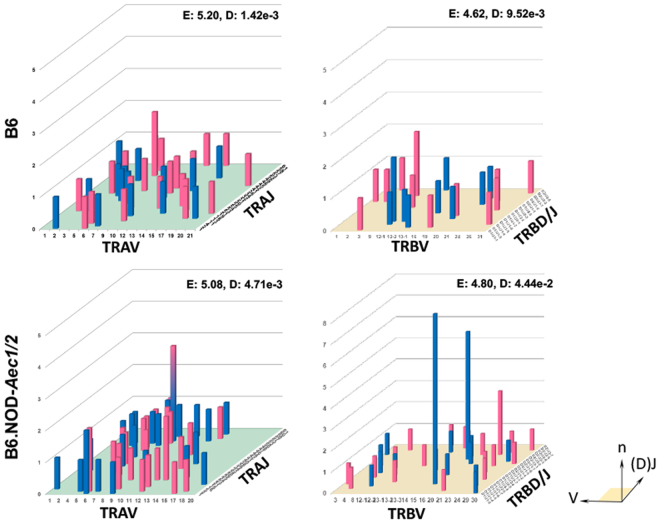
Figure 3.
Loss of normal distribution in V/J pairing is associated with the SjSS mouse. Total salivary gland T-lymphocyte three dimensional histograms of TCR gene V/(D)J combinations for B6 TRA (upper left) and B6 TRB (upper right) genes, as well as B6.NOD-Aec1/2 TRA (lower left) and TRB (lower right) genes. Blue bars indicate data from male mice, pink from female mice, and hybrid blue-pink bars for data shared between the sexes. The x-axis represents the analyzed Vα or Vβ gene segment, the z-axis is the analyzed Jα or D/Jβ gene segments, the height or y-axis indicates the total reads of specific V/(D)J combination. V and J genes were designated by the disambiguated IMGT nomenclature for each gene subgroup. TCR repertoire was quantified by entropy (E = Shannon’s Entropy) and diversity (D = Simpson’s Index).

