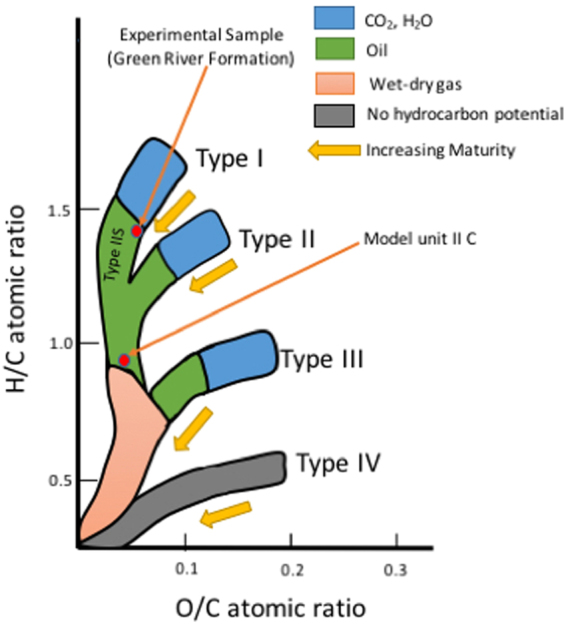
Figure 1.

van Krevelen diagram showing the four types of kerogen and how their elemental compositions change as they mature. The red dots show the types of kerogen used in the experiments and molecular dynamics simulations presented in the text. The H/C and O/C ratios of kerogen sample used in experiments are 1.46 and 0.07, respectively based on the elemental composition of kerogen isolated from Mahogany zone, Green River Formation in a previous work24. The H/C and O/C ratios of molecular model of kerogen (unit II C from Ungerer) are 0.905 and 0.054, respectively. The plot is re-drawn after the work of McCarthy et al.25.
