Fig. 1.
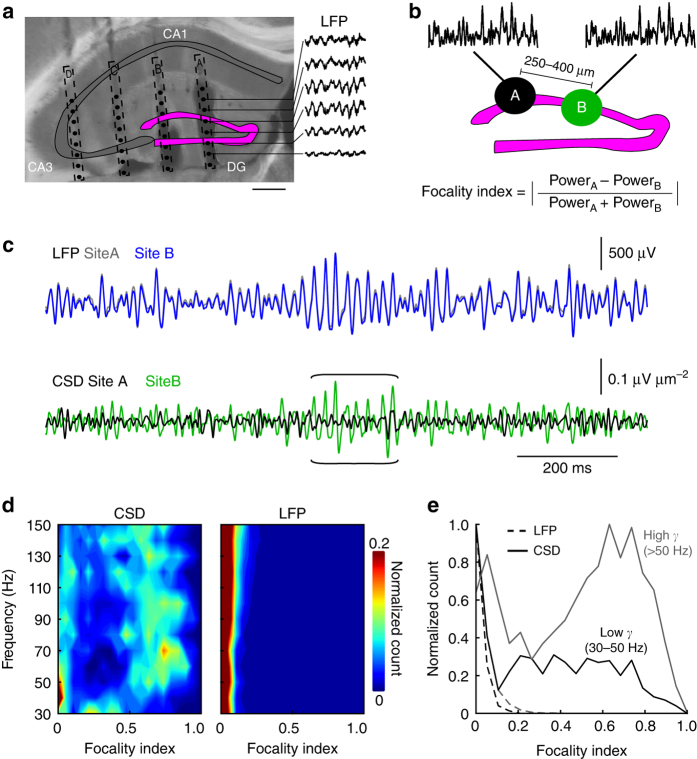
Focal gamma bursts emerge in the dentate gyrus of freely moving mice. a Electrode tracks of the silicon probe used for LFP recording (shank spacing: 250–400 µm, electrode pitch: 25–100 µm, 8–16 recording sites/shank). Insets on the right show raw LFP traces recorded at the sites indicated. The position of the recording sites was determined post hoc (see “Methods”). Scale bar 400 µm. b Schematic illustration of the method used to quantify the focality of gamma oscillations. For each gamma epoch detected on recording sites A and B within the dentate gyrus granule cell layer (gcl) on neighboring shanks, we measured a focality index, which ranges theoretically from 0 (equal gamma power on both recording sites A and B) to 1 (total gamma power located on one of the recording sites A or B). c Gamma-filtered (30–150 Hz) LFP (top) and the resulting CSD traces (bottom) of recordings in the gcl at 250 µm shank spacing. Note that the CSD reveals epochs of local gamma activity on one shank (brackets) while no difference in gamma amplitude is apparent when considering LFPs. d 2D histogram of focality index as a function of gamma frequency for CSD (left) and LFP (right). High focality indices are observed at frequencies above ~50 Hz in CSD but not LFP traces. In CSD recordings, for frequencies < 50 Hz focality indices are mostly < 0.1. e Normalized histograms of focality indices of low gamma (30–50 Hz, black) and high gamma (50–150 Hz, gray) epochs. Data are from N = 4 mice

