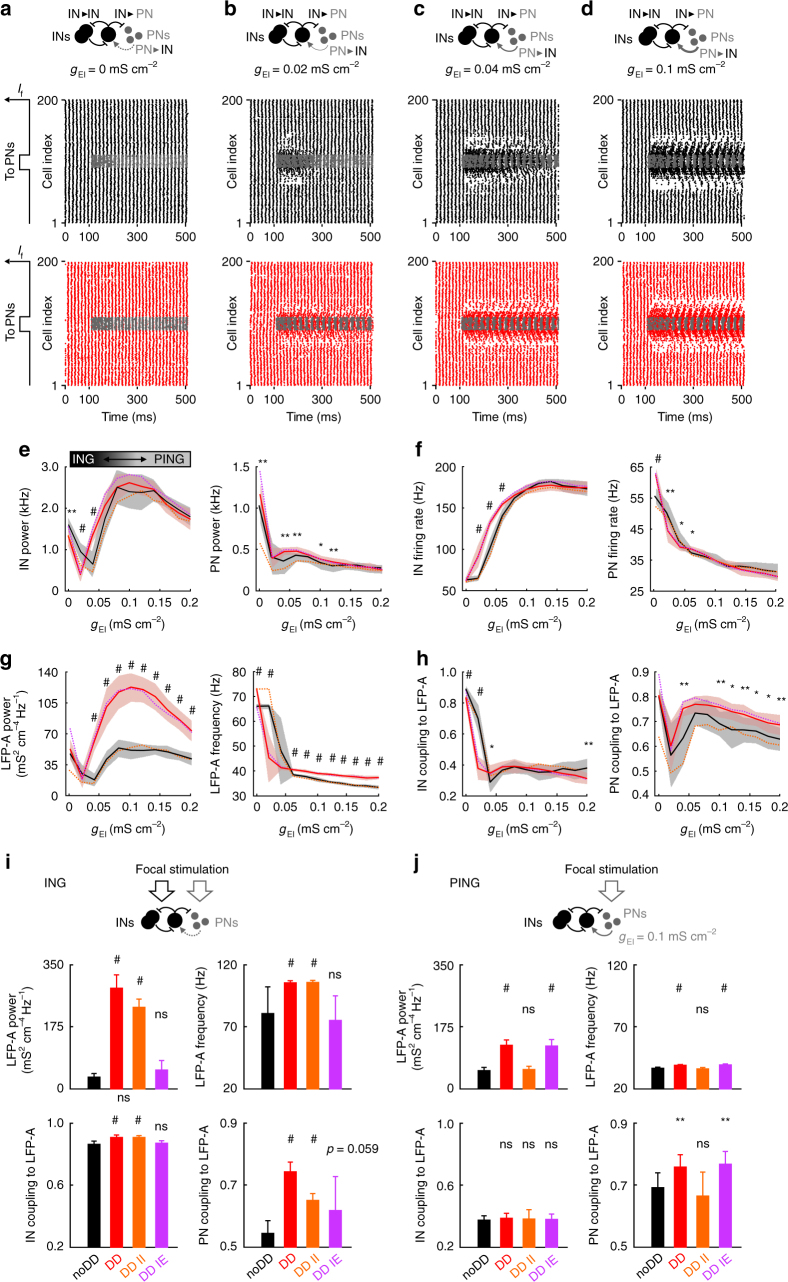
Fig. 4.
Distance-dependent inhibition boosts focal PING oscillations and PN spike timing. a–d Local rhythmic activity is induced by focal stimulation of a subgroup of only PNs in networks with different strengths (g EI) of feedback excitatory synapses to INs (PN–IN). Top, schematic of the circuit. Bottom, raster plots showing the activity in the IN (noDD: black; DD: red) and PN (gray) population before and after stimulus onset at t = 100 ms for 100 ≤ t < 500 ms. e–h Central network activity for different g EI values. Black (noDD) and red (DD) continuous lines and shaded areas indicate means ± SD for 10 simulation runs. Dashed lines indicate means of 10 simulations in chimeric DD networks with distance dependence only in either IN–IN (DD II, orange) or IN–PN synapses (DD IE, purple). e Dominant oscillation frequency and corresponding power of mean momentary IN and PN firing rates. f Average firing rates of INs and PNs. g Dominant oscillation frequency and corresponding power of the recorded LFP-A. h Mean coupling strength of IN and PN spikes to the LFP-A. Note that for g EI = 0 mS cm−2, the network generates ING oscillations. With increasing feedback excitation, the network switches to PING, corresponding to a drop in the oscillation frequency (g, right; see also schematic in e, top left). Statistical analysis compares noDD and DD networks. i Average properties of focal oscillations in noDD, DD and the chimeric DD II and DD IE networks. To elicit ING oscillations, PN–IN feedback was switched off and both INs and PNs received focal stimulation (cf. Fig. 3b). Top, dominant oscillation frequency and corresponding power of LFP-A of the central network. Bottom, focal IN and PN coupling to the LFP-A. j Analysis of focal gamma activity resulting from PING-based synchronization, corresponding to i. Networks contained PN–IN feedback (g EI = 0.1 mS cm−2) and only PNs received the focal excitation. Bars and error bars indicate mean and SD of 10 simulation runs. Statistical analysis compares all three DD networks to the noDD circuit. *p < 0.05; **p < 0.01; # p < 0.001; two-tailed, two-sample t-test

