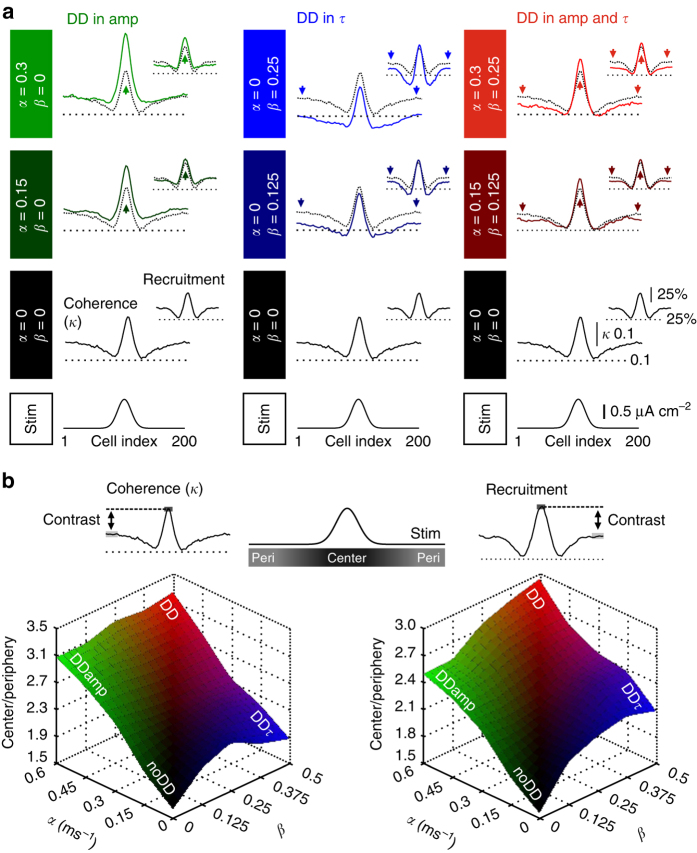
Fig. 5.
Distance dependence in amplitude and time course of IPSCs at IN–IN synapses synergistically increases the contrast between center and periphery in an IN network model. a Local analysis of the coherence κ (left traces in each panel) and recruitment (smaller right traces in each panel) over 20 INs at each position in the network. Analysis was performed in the noDD network (black lines in each panel), in the DDamp (left column, green traces), DDτ (middle column, blue traces) and the full DD network (right column, red traces). For each column from bottom to top: Schematic illustrating the focal stimulation to the center of the network. Local κ and recruitment in the noDD network. Comparison of local κ and recruitment in the different DD networks (colored traces) with the noDD network (black dotted traces). Values of the respective DD coefficients α and β increase progressively. Arrows indicate dominant effect of distance-dependent inhibition. b Top, schematic illustrates “center” (cells #91-110) and “periphery” (cells #1-30 and #171-200). Bottom, the center-to-periphery ratio of κ (left) and recruitment (right) was plotted against DD coefficients. The noDD network (α = 0|β = 0) shows lowest contrast. Note, in combination, distance-dependent amp and τ result in the highest contrast between center and periphery (red). All data are averages of 50 simulation runs

