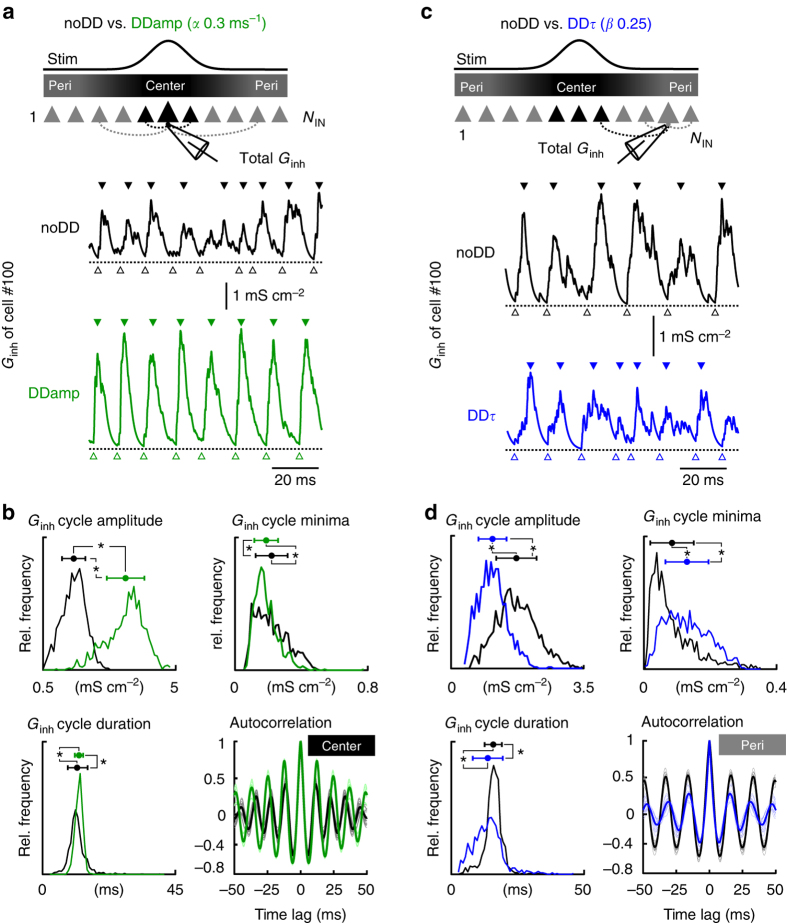
Fig. 6.
Distance-dependence in the amplitude boosts synchrony of central inhibition and distance-dependence in the time course desynchronizes inhibition in the periphery of an IN network model. a Representative total inhibitory conductance (G inh) recorded from a cell (#100) exposed to focal stimulation (Stim) in the noDD (black trace) and the DD0.3|0 (green trace) interneuron network model with distance-dependent amplitudes only (DDamp). Rhythmic patterns of G inh at gamma frequencies display peaks (filled triangles) followed by troughs (open triangles) in an alternating manner. b Distributions of amplitude, minima (open triangles in a) and duration of total G inh cycles. In the DD0.3|0 network, mean amplitude of G inh is significantly larger (p < 0.001, Mann–Whitney U-test) and duration less variable (SD) than in the noDD network (p < 0.001, Ansari–Bradley test). Bottom right, the average autocorrelation of the G inh in central cells (#99-101) shows that periodicity of the G inh is higher in the DD0.3|0 network. c In analogy to a, representative G inh recorded from a cell (#10) in the periphery of the noDD (black trace) and the DD0|0.25 (blue trace) interneuron network model with distance-dependent time course only (DDτ). d Distributions of amplitude, minima and duration of G inh cycles. In the periphery, G inh in the DD0|0.25 circuit displays smaller cycle amplitudes (top left), higher residual inhibition at the troughs (top right) and a broader standard deviation of G inh cycle durations (bottom left). The weaker periodicity of the inhibition in the periphery of the DD0|0.25 network is further confirmed by the auto-correlogram (bottom right, blue). Points with error bars represent mean and SD. Data in b, d are based on five simulation runs

