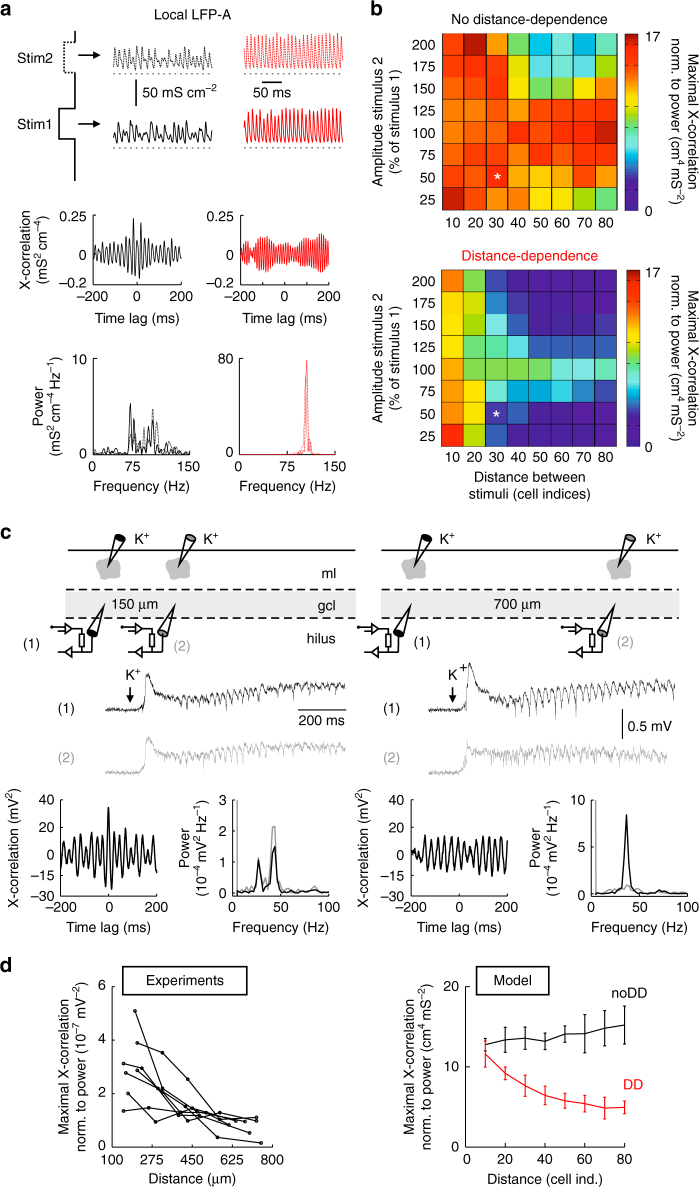
Fig. 7.
Parallel emergence of multiple local gamma oscillations in distance-dependent IN–PN network models and in vitro. a Top, LFP analog (LFP-A) recorded at the site of Stimulus 1 and 2 presented to the network at different locations (black: noDD, red: DD network). Middle, cross (X)-correlation of recorded LFP-A signals at stimulation site 1 and 2. Bottom, power spectra of the LFP-A recorded at stimulation site 1 (continuous line) and 2 (dashed line). The amplitude of the second stimulus was 50% of the first one; edge-to-edge distance between both stimuli was 30 cell indices. b Maximal LFP-A X-correlation was normalized to the 10–150 Hz power recorded at both stimulation sites (averages of 10 simulation runs). Asterisks indicate the situation depicted in a. c Top, schematic illustration of the experimental condition. Middle, representative LFPs recorded at distances of 150 and 700 µm and low-pass filtered at 1 kHz. Bottom, X-correlograms and power spectra are shown for the corresponding LFPs. d Left, summary plot representing normalized maximal X-correlation between both LFP signals as a function of the distance between the two recording electrodes. Right, comparison to the theoretical data from b (blue, noDD; red, DD network). Data points are averages of Stimulus 2 amplitudes 75–125% (10 runs each). Error bars indicate the SD

