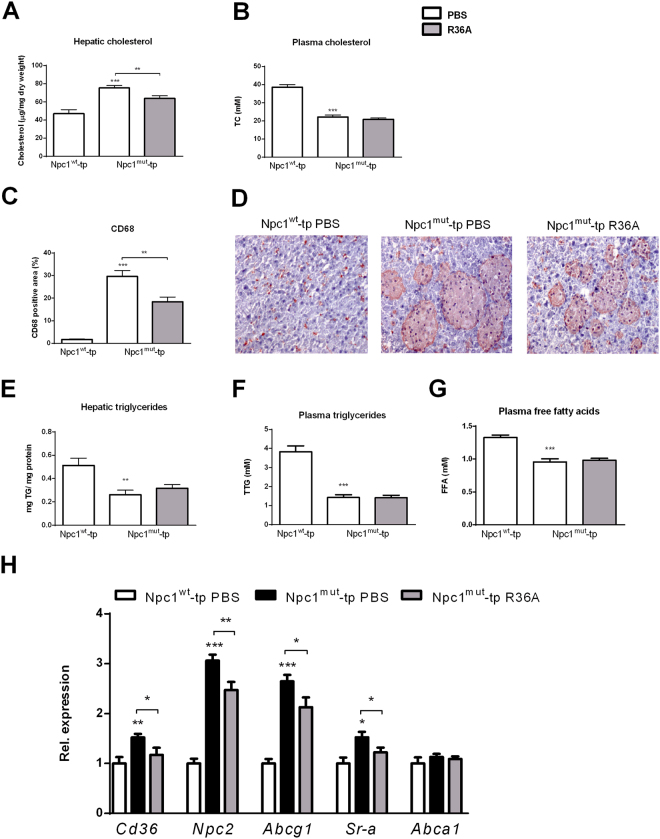
Figure 2.
Lipid parameters. (A,B) Hepatic and plasma cholesterol levels of Npc1 wt-tp and control-treated or immunized Npc1 mut-tp mice on HFC diet. (C) Quantification of CD68 staining by measuring CD68 positive area. (D) Representative histological pictures of the CD68 staining (200x magnification). (E,F) Hepatic and plasma triglyceride levels. (G) Plasma free fatty acids. (H) Hepatic gene expression analysis of Cd36, Npc2 and Abcg1, Sr-a and Abca1. n = 9–11 mice/group. Gene expression data are set relative to Npc1 wt-tp mice. Asterisks indicate significant difference from non-immunized Npc1 wt-tp and Npc1 mut-tp mice by use of two-tailed unpaired t test. *, ** and *** indicate p < 0.05, 0.01 and 0.001 resp. All error bars are SEM. TC, total cholesterol; TTG, total triglycerides.

