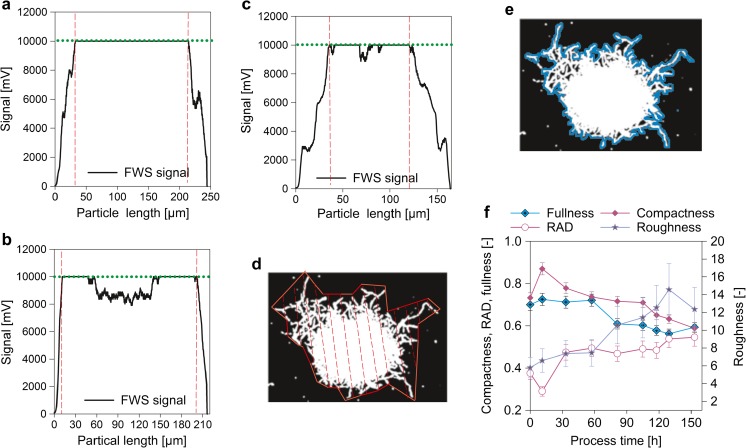
Fig. 4.
Fullness and roughness from the microscopy method and corresponding parameters deriving from the FWS signal of the flow cytometer. a–c The FWS signals of three pellets are shown. The inner pellet core is indicated by two vertical lines. The horizontal line shows the saturation of the FWS signal. a Pellet with low relative annular diameter (0.26) and high compactness (1.0). b Pellet with very low relative annular diameter (0.12) and low core compactness (0.49). c Pellet with high relative annular diameter (0.46) and average core compactness (0.77). d, e Pellet pictures from microscopy after conversion to a binary image. The convex area for fullness calculation (d) and the perimeter for roughness calculation (e) are shown. The area for calculation of these to parameters is the sum of all white pixels of the pellet. f Comparison of RAD determined via flow cytometry and pellet fullness and roughness measured with microscopy for FB2. In addition, core compactness is shown. Pictures of the pellets shown in Fig. 4 a–c can be found in Fig. S2 in the supplementary material

