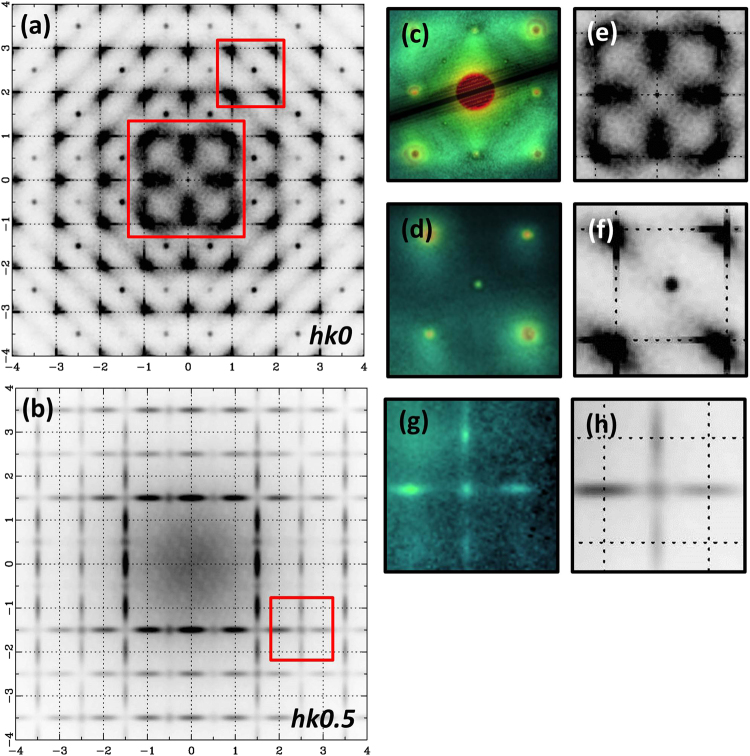
Figure 7.
Simulated electron diffraction patterns. (a) hk0 reciprocal-space plane. (b) hk0.5 reciprocal-space plane. (c), (d) Enlarged images of the regions depicted by white squares in the experimental hk0 pattern (Fig. 3b) compared with the corresponding calculated region (e), (f). (g) Enlarged image of the region depicted by the white square in the experimental hk0.5 pattern (Fig. 3c) compared with the corresponding calculated region (h). The diffraction patterns were calculated using the kinematical approximation from a 50 × 50 × 50 supercell with an antiphase/in-phase ratio of 30/70 and in-phase tilted domains of 10 × 10 × 2 unit cells large. A small degree of Na/Bi CSRO together with Na/Bi correlated displacements along <001>pc and <111>pc directions were also considered. The simulated electron diffraction patterns were obtained by averaging the results from 20 different simulations, in order to reduce the anisotropic contribution to the diffraction intensities.

