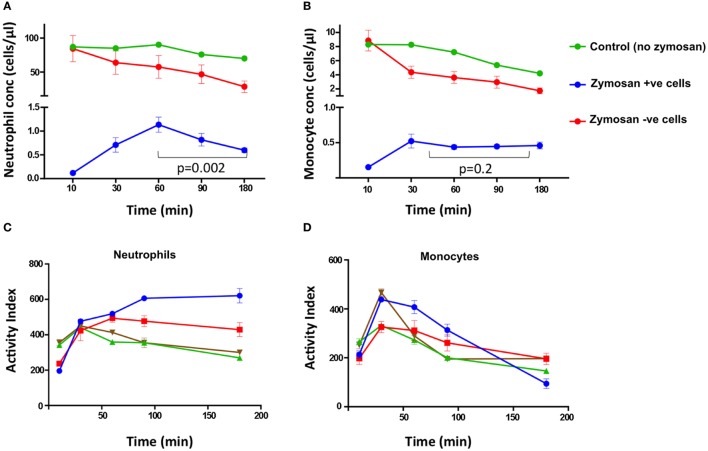
Figure 4.
Cell concentrations and activity index (AI) of superoxide burst over time. The concentration of neutrophils (A) and monocytes (B) at different time points from HIV-negative control samples without zymosan (green), and samples incubated with zymosan reporter beads that had internalized zymosan (blue) or did not internalize zymosan (red). In (C) neutrophils and (D) monocytes, each color represents the superoxide AI data from different individuals. The AIs are from four healthy, HIV-negative individuals, each performed in triplicate.

