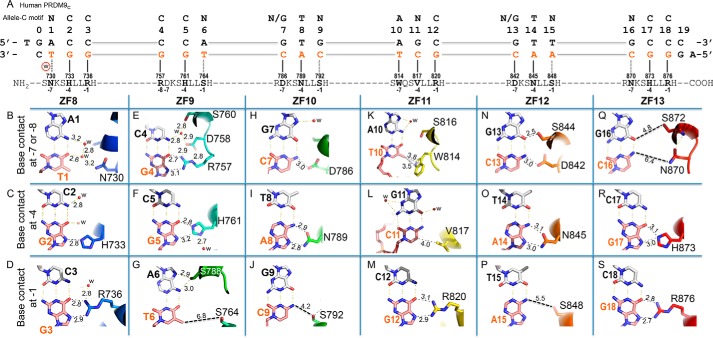
Figure 2.
PRDM9c ZF8–13 form base-specific interactions. A, schematic representation of ZF8–13 interactions with DNA. The top line indicates the 18-bp consensus sequence. The second line indicates the base pair positions (positions 0–19). The third and the fourth lines are the sequence of the double-stranded oligonucleotide used for crystallization, shown with the top strand matching the consensus sequence. Amino acids of each finger interact specifically with the DNA bases, as shown below. B, DNA base-specific interactions involve a particular residue of each ZF. Atoms are colored dark blue for nitrogen and red for oxygen, and carbon atoms are decorated with finger-specific colors according to Fig. 1F. The numbers indicate the interatomic distance in angstroms (between protein and DNA). For clarity, the H-bond distances for Watson–Crick base pairs are not shown. w, water molecules (small red spheres). C, His733 interaction with G2. D, Arg736 interaction with G3. E, Arg757 interaction with G4. F, His761 interaction with G5. G, Ser764 is positioned too far away from T6. H, Asp786 interaction with C7. I, Asn789 interaction with A8. J, Ser792 forms a weak H-bond with C9. K, Trp814 forms a π–methyl interaction with the T10 methyl group. L, Val817 forms a van der Waals contact with C11. M, Arg820 interaction with G12. N, Asp842 and Ser844 interaction with the G13:C13 base pair. O, Asn845 interaction with A14. P, Ser848 is too far away from A15. Q, Asn870 and Ser872 are positioned too far away from the G16:C16 base pair. R, His873 interaction with G17. S, Arg876 interaction with G18.

