
Figure 4.
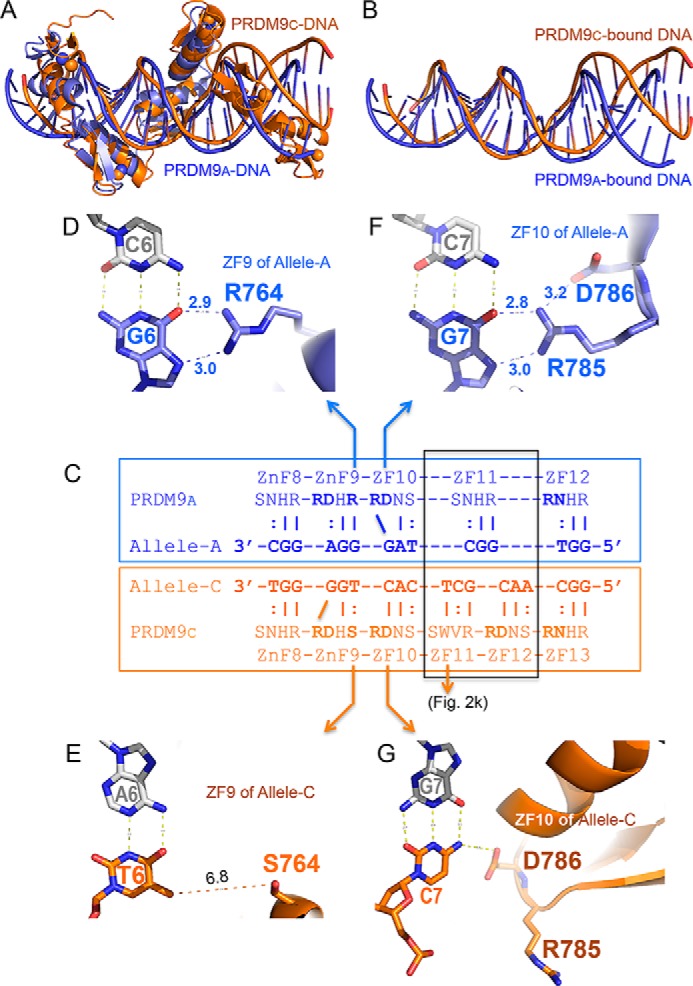
Comparison of PRDM9a and PRDM9c interaction with allele-specific DNA. A, superimposition of PRDM9a-DNA (blue; PDB entry 5EGB) and PRDM9c-DNA (orange) complex structures. B, superimposition of PRDM9a-bound DNA molecule (blue) and PRDM9c-bound DNA molecule (orange). For clarity, the protein components have been removed from the superimposition. C, the allele A–specific sequence (blue) and allele C–specific sequence (orange) are aligned to the corresponding ZF with amino acids at the −8, −7, −4, and −1 positions (see Fig. 1B, top). The expansion of one finger (ZF11) in PRDM9a to two fingers (ZF11–12) in PRDM9c is highlighted in a gray box. D, Arg764 of allele A interacts with G6. E, Ser764 of allele C allows a variable base at base pair position 6. F, RD dipeptide of ZF10 in allele A interacts with G7. G, RD dipeptide of ZF10 in allele C interacts with C7.