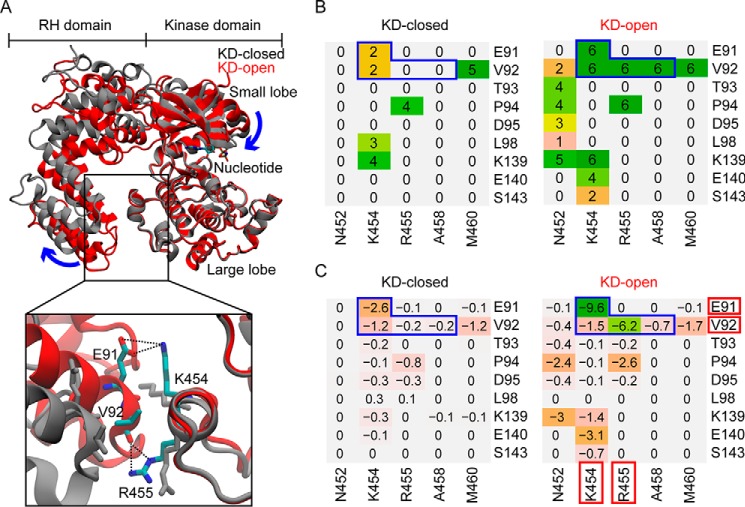
Figure 2.
Residue contact and energy analyses focused on the RHD-large lobe interface identify potential residues involved in GRK activation. A, superposed GRK4 subfamily KD-closed (gray) and KD-open (red) structures. Bottom, a closer view of the RHD-large lobe interface with key residues shown as sticks and their interactions shown as black dotted lines. B, residue contact analysis for each structural group. The value associated with each residue pair indicates the number of structures in the group in which the two residues are in contact. Regions outlined by blue lines contain residue pairs that form contact in all the KD-open structures but either lose the contact completely or form a contact much less frequently in the KD-closed structures. C, residue-residue interaction energy (kcal/mol) averaged over structures calculated for the same residue pairs as in B (see “Experimental procedures”). Residues that form the strongest polar and/or hydrophobic interactions are highlighted by red blocks.

