
Figure 2.
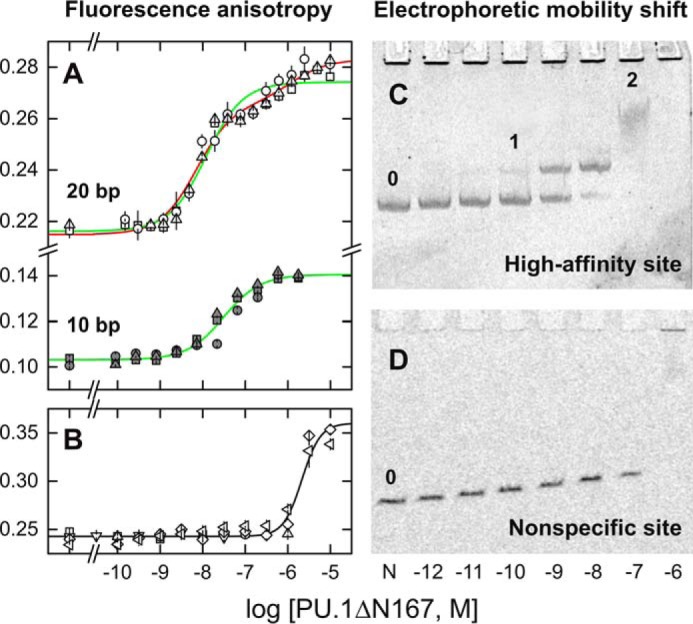
Sequence and site size requirements for sequential dimerization of the specific DNA-bound ETS domain of PU.1. A and B, fluorescence polarization titrations of Cy3-labeled 20-bp DNA probes (22) harboring the high-affinity site (A) 5′-AGCGGAAGTG-3′ or its isomeric nonspecific variant (B) 5′-AGCGAGAGTG-3′ with PU.1ΔN167. The 10-bp duplex in A was constructed by annealing the labeled strand with a 10-bp complement encoding only the core ETS-binding site. Symbols represent data from independent replicate experiments. Curves represent a least-square fit of the data from triplicate experiments to a sequential 2:1 binding model (red) or constrained to a 1:1 model (green). The latter afforded a significantly poorer fit of the data (p < 1 × 10⁻⁴, Fisher's F-test on sums of squares). The nonspecific data were fitted with the Hill equation (black). Error bars, S.E. C, electrophoretic mobility shift titration of a 209-bp DNA fragment (1 nm, marked 0) harboring a single copy of the high-affinity site with PU.1ΔN167. Following formation of the 1:1 complex (marked 1), a discrete, low-mobility species was present at 0.1 μm protein (labeled 2). At 1 μm protein (103-fold excess), a nonspecific complex finally formed, which did not enter the gel, as confirmed with a fragment harboring the nonspecific sequence (D). The shadows lining the wells in C represent an irregular imaging artifact of the stained gel, not protein-bound DNA, as it was observed even in the negative-control lane containing no PU.1 (marked 0).