Figure 5.
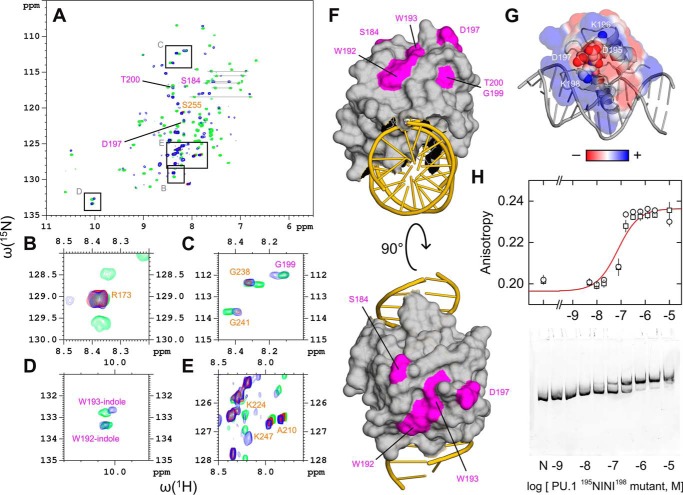
Mapping the dimerization interface of the site-specific 2:1 complex. A, overlay of 1H-15N HSQC spectra in the absence (green) or presence of 16-bp site-specific DNA at 0.5 (red) and 1.0 (blue) molar ratios. Peaks labeled in orange that showed strong overlap among all three states (blue/red/green) were taken to represent residues not involved in site-specific dimerization. Peaks labeled in purple that overlapped only in the unbound and 1:1-bound states (blue/green) were taken to represent residues involved in dimerization. Assigned resonances were as reported for residues 167–260 by Jia et al. (27). Boxes indicate regions that are magnified in B–E. F, mapping of the (purple) residues implicated in PU.1 dimerization to the 1:1 co-crystal structure (PDB code 1PUE). G, continuum electrostatic surface potential of PU.1 in the co-crystal structure. The residues 195DKDK198 are shown as spheres. H, DNA-binding profiles of a 195NINI198 mutant of PU.1ΔN167 by fluorescence polarization (20 bp) and gel mobility shift (209 bp) under the same experimental conditions as in Fig. 2. Symbols represent replicate experiments; the curve represents a 1:1 fit to the data. Error bars, S.E.

