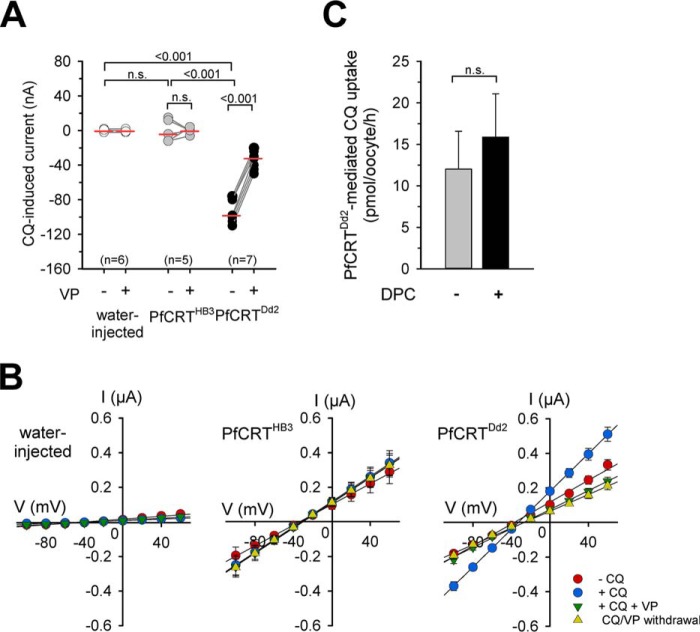
Figure 2.
Chloroquine-induced currents in PfCRTDd2-expressing oocytes. A, water-injected oocytes (white circles), PfCRTHB3-expressing oocytes (gray circles), and PfCRTDd2-expressing oocytes (black circles) were voltage-clamped (−50 mV) while superfused with ND10 buffer, pH 6.0. The currents induced upon the addition of 100 μm chloroquine (CQ) were measured before and after supplementation of the medium with 100 μm VP in paired experiments. The lines connecting two data points indicate the response of a single oocyte before and after the treatment. The number of oocytes (n) investigated is indicated above the x axis. The medians are indicated as red lines. The statistical significance was assessed using the Kruskal–Wallis one-way ANOVA on ranks test or the paired t test, where appropriate. The corresponding p values are indicated on the graphs. n.s., not significant. B, current–voltage relationships of water-injected oocytes (left), PfCRTHB3-expressing oocytes (middle), and PfCRTDd2-expressing oocytes (right) were first obtained in ND10 buffer (red-filled circles) and then ND10 buffer containing 100 μm chloroquine (blue-filled circles) before adding 100 μm VP (green-filled inverted triangles). I/V curves upon withdrawal of both compounds are indicated by yellow-filled triangles. Each data point represents the mean ± S.E. (error bars) from n = 15 oocytes. C, PfCRTDd2-mediated chloroquine uptake in the presence and absence of 1 mm DPC. PfCRTDd2-expressing oocytes and water-injected oocytes were incubated in ND96 buffer supplemented with and without 1 mm DPC and containing 42 nm [3H]chloroquine and 50 μm unlabeled chloroquine for 60 min at 25 °C. To calculate the amount of PfCRTDd2-mediated transport, the amount of chloroquine taken up by water-injected oocytes was subtracted. The data represent the means ± S.E. of NBR = 4 independent biological determinations. n.s., not significant according to a t test.

