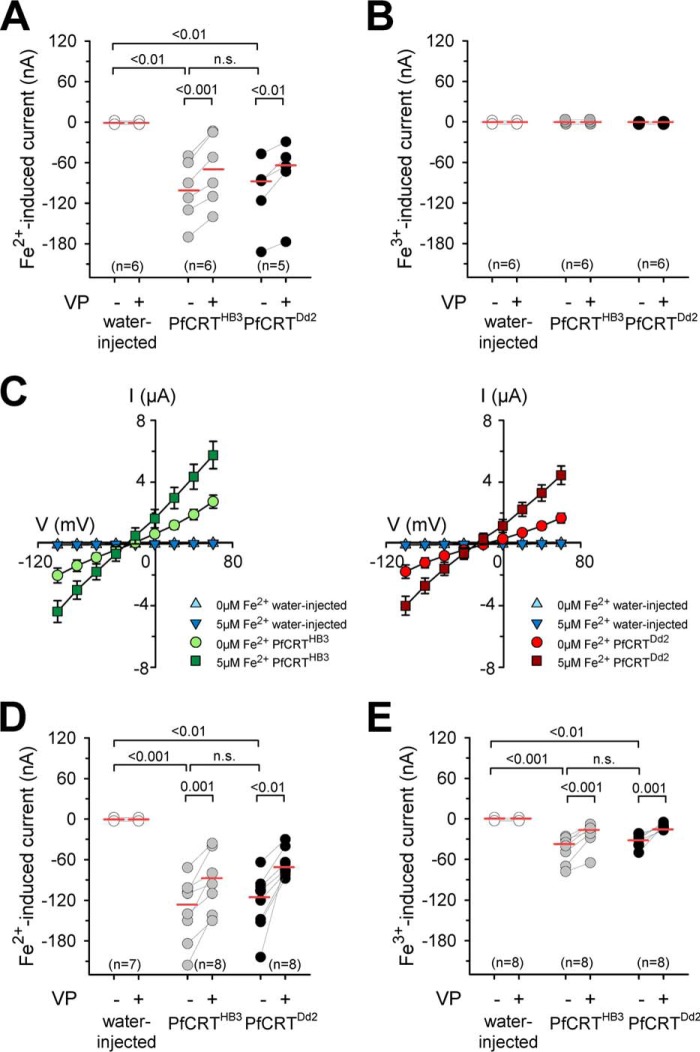
Figure 4.
Iron-induced inward currents in PfCRT-expressing X. laevis oocytes. A and B, water-injected oocytes (white circles), PfCRTHB3-expressing oocytes (gray circles), and PfCRTDd2-expressing oocytes (black circles) were voltage-clamped (−50 mV) while superfused with ND10 buffer, pH 6.0. Iron was maintained in divalent form or trivalent form by adding to the buffer a quadruple ratio of l-ascorbic acid or nitrilotriacetic acid, respectively. The currents induced by adding 5 μm Fe2+ (A) or 5 μm Fe3+ (B) were measured before and after supplementation of the medium with 100 μm VP. The number (n) of oocytes is indicated above the x axis. The medians are indicated as red lines. The statistical significance was assessed using the Kruskal–Wallis one-way ANOVA on ranks test or paired t test, where appropriate. The corresponding p values are indicated on the graphs. C, current–voltage relationships of water-injected oocytes and PfCRTHB3-expressing oocytes (left) and water-injected oocytes and PfCRTDd2-expressing oocytes (right) were obtained in ND10 buffer, pH 6.0, in the presence and absence of 5 μm ferrous iron. Each data point represents the mean ± S.E. (error bars) of n = 12–15 oocytes. D and E, as in A and B, but this time, a concentration of 1 mm ferrous (D) or ferric (E) iron in ND10-mannitol buffer, pH 6.0, was used. n.s., not significant.

