Figure 2.
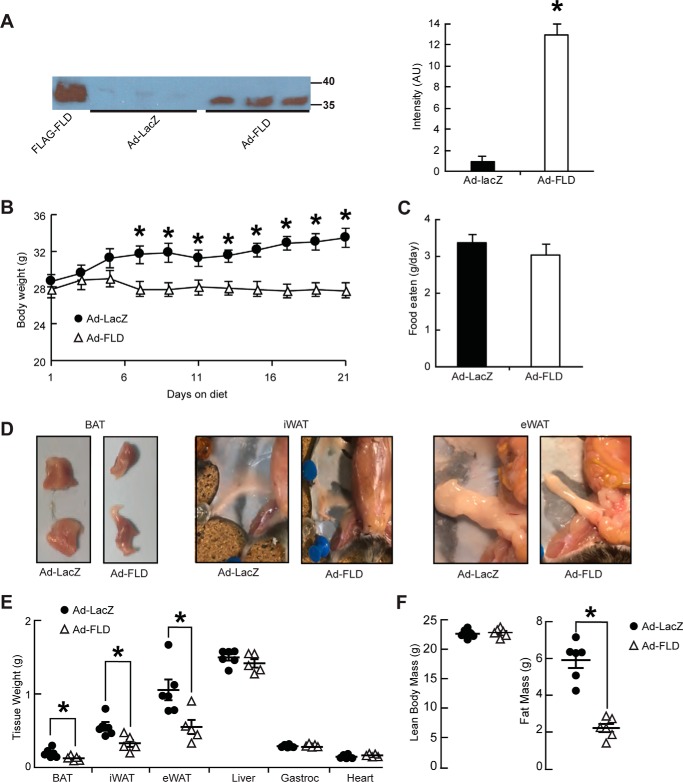
Increasing circulating levels of FLD in isolation limits DIO in mice. A, immunoblot (left panel) and quantification (right panel) of purified (20.5 ng) FLAG-FLD proteins and plasma samples (3 μl) from Ad-LacZ and Ad-FLD mice, using an anti-FLAG M2 antibody (Sigma, 1:1000). Plasma was isolated from both Ad-LacZ and Ad-FLD mice 10 days after infection. B and C, body weight curves (B) and average food intake values (C) for Ad-LacZ and Ad-FLD mice fed a HFD for 3 weeks. D, representative images showing the reduction in BAT, iWAT, and eWAT masses induced by FLD overexpression in the context of a HFD. E, quantification of C, as well as equivalent weight values for other tissues represented in percentage of body weight in Ad-LacZ and Ad-FLD mice fed HFD for 3 weeks. F, respective lean and fat masses represented in percentage of body weight in the mice mentioned above, as determined by DEXA, showing the specific reduction in fat mass seen in Ad-FLD mice fed a HFD for 3 weeks. In all cases, n = 6 mice/group; *, p < 0.05 versus Ad-LacZ.

